Kipp&Zonen LOGBOX SD Data Logger User Manual
Page 33
33
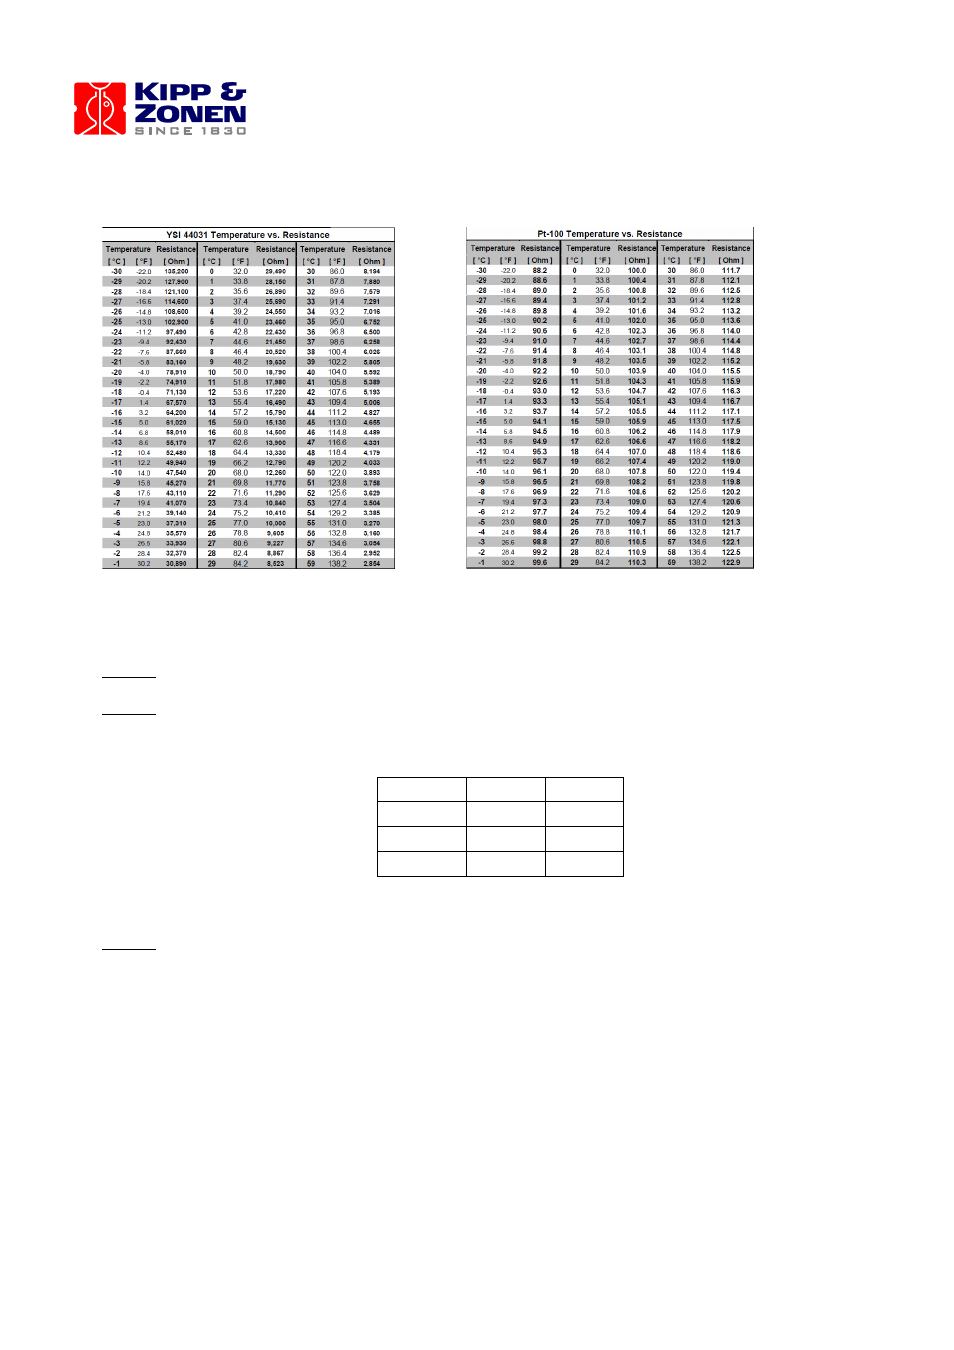
Figure 1
Figure 2
Let’s begin to create our own polynomials:
Step 1: Collect the information as shown in figure 1 and 2.
Step 2: Insert this information in an excel sheet. (See Figure 3)
It is advisable to insert all the data. (The example only shows 4 values)
R
C
F
135,200
-30
-22
127,900
-29
-20,2
121,100
-28
-18,4
114,600
-27
-16,6
Figure 3.
Step 3: Translate this information into a graphical chart. (See figure 4)