Extended views, Temperature graph – Welch Allyn SureTemp PlusModule - User Manual User Manual
Page 80
SureTemp Plus PC Display
SureTemp Plus Module OEM Implementation
80
Confidential
Welch Allyn OEM Technologies
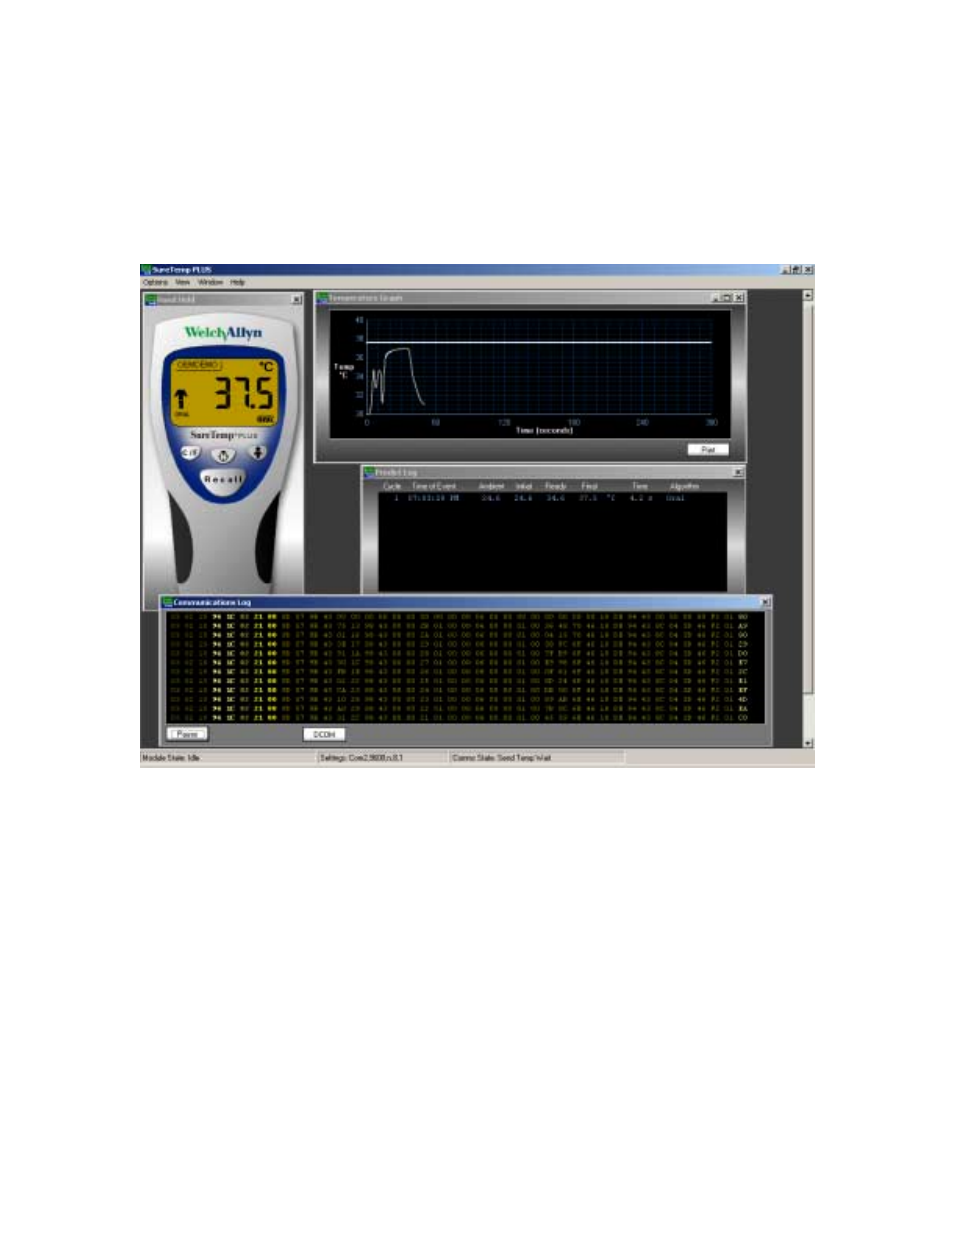
Extended Views
Extended View options can be selected from the View drop-down menu. When selected, the
window is expanded to provide additional data. The Extended View adds a temperature graph, a
predict log, and a communications log.
Figure 14. Extended View Options
Temperature Graph
The temperature graph provides a real-time plot of temperature vs. time. If selected, or when first
opened, the normal drop-down menus are replaced with the Graph drop-down menu. To switch
back to the normal menus, click on any other open window. The graph scales can be configured
in the View drop down menu.
Size the graph by grabbing a corner or edge with the mouse.
All temperature data in this view is in the units selected for the Handheld's LCD display.
During the predicting state, the plotted temperature curve changes from gray to white. In the
Normal (Predict) mode, when the final temperature is reached, a horizontal line indicates the
final temperature value.
- GS 777 Wall Transformer - User Manual (1 page)
- 7114x Desk Charger - User Manual (8 pages)
- Mounting Bracket Replacement Kit for 7670-12 Mobile Stand with Mounting for 767XX and 777XX - User Manual (2 pages)
- 767 Diagnostic System - User Manual (16 pages)
- 767 Diagnostic System - User Manual (136 pages)
- 118 Series PanOptic Ophthalmoscope - User Manual (28 pages)
- 118 Series PanOptic Ophthalmoscope - User Manual (26 pages)
- VS100 Welch Allyn Vision Screener - User Manual (34 pages)
- SureSight Vision Screener - User Manual (36 pages)
- SureSight Vision Screener - User Manual (32 pages)
- Connex Integrated Wall System - User Manual (161 pages)
- SureSight Autorefractor - User Manual (36 pages)
- 12500 Binocular Indirect Ophthalmoscope Power Source - User Manual (12 pages)
- TM286 Auto Tymp - User Manual (72 pages)
- TM 262 Auto Tymp - User Manual (92 pages)
- MicroTymp 3 portable tympanometric instrument - User Manual (76 pages)
- Audioscope 3 Portable Screening Audiometer - User Manual (32 pages)
- AM282 Audiometer - User Manual (32 pages)
- AM 232 Manual Audiometer - User Manual (38 pages)
- Digital MacroView Otoscope - User Manual (476 pages)
- Digital MacroView Otoscope - User Manual (32 pages)
- OAE Hearing Screener - User Manual (62 pages)
- OAE Hearing Screener - User Manual (56 pages)
- OAE Data Manager - User Manual (39 pages)
- Ear Wash System 29350 - User Manual (28 pages)
- Standard laryngoscope blade assemblies - User Manual (6 pages)
- Standard laryngoscope handles - User Manual (6 pages)
- Rechargeable laryngoscope handles - User Manual (8 pages)
- Fiber optic laryngoscope handles - User Manual (7 pages)
- Fiber optic laryngoscope blade assemblies - User Manual (6 pages)
- Original Harvey and Harvey DLX Double and Triple Head Stethoscopes - User Manual (28 pages)
- Harvey Elite Stethoscope - User Manual (2 pages)
- Professional Stethoscope - User Manual (2 pages)
- EXPENDABLE ILLUMINATOR - User Manual (2 pages)
- KleenSpec Single Use Vaginal Speculum - User Manual (2 pages)
- KleenSpec Vaginal Specula Illumination System - User Manual (20 pages)
- KleenSpec 790 Series Cordless Illumination System - User Manual (32 pages)
- KleenSpec 790 Series Cordless Illumination System - User Manual (222 pages)
- Video Colposcope - User Manual (400 pages)
- Video Colposcope - User Manual (48 pages)
- Rigid Reusable & Single use Sigmoidoscopes, Anoscopes, Accessories - Cleaning, Disinfection, and Sterilization - User Manual (12 pages)
- 6V Power Supply, Rectal Light Handle - User Manual (240 pages)
- Fl-100 Intubating Fiberscope - User Manual (32 pages)
- EpiScope Skin Surface Microscope - User Manual (2 pages)
- 719 Series Lithium Ion Handle - User Manual (4 pages)