Entering and editing statistical data, Entering and editing statistical data -5, Predict values – HP 39g Graphing Calculator User Manual
Page 99
Attention! The text in this document has been recognized automatically. To view the original document, you can use the "Original mode".
Predict values
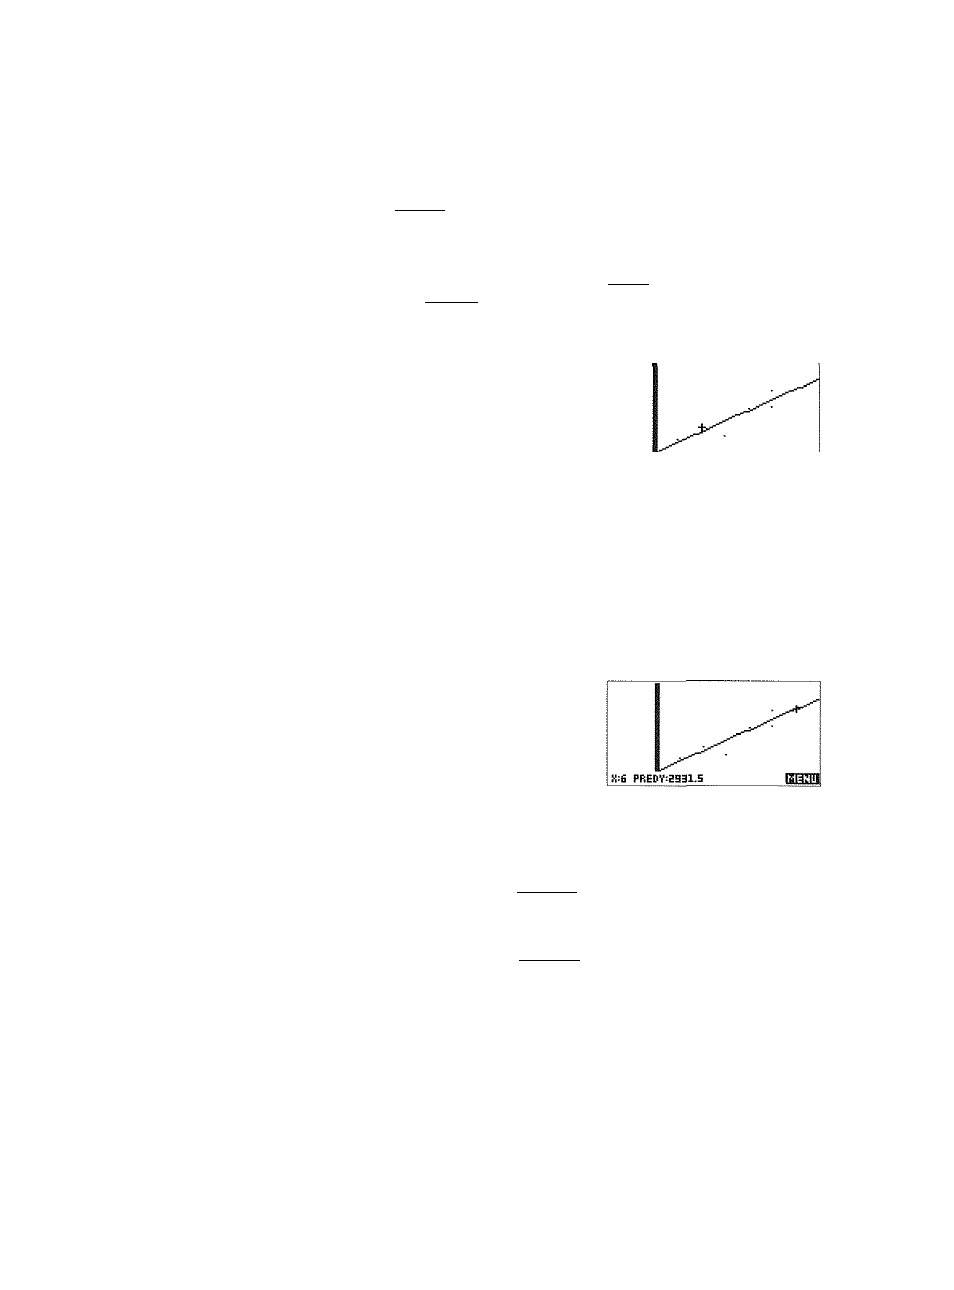
13. To find the predicted sales figure if advertising were to
go up to
6
minutes:
HOME
fMATH
I S {to highlight
Stat-Two)
0
0
Cto highlight
PREDY)
H16 I
ENTER
I
14. Return to the Plot view.
8033^^» s
PREDYC6>
2931.5
iil'iiai
PLOT
15. Jump to the indicated point on the regression line.
a CTE
6
64
Observe the predicted y-
value in the left bottom
comer of the screen.
Entering and editing statistical data
The Numeric view (pRpiiTI) is used to enter data into the
Statistics aplet. Each column represents a variable named CO
to C9. After entering the data, you must define the data set in
the Symbolic view
(fsYMBl).
H I N T A data column must have at least four data points to provide
valid two-variable statistics, or two data points for one-
variable statistics.
You can also store statistical data values by copying lists from
HOME into Statistics data columns. For example, in HOME,
LI
Hffl3
Cl
stores a copy of the list
LI
into the data-column
variable
Cl.
Statistics aplet
8-5