Fitting a curve to 2var data, Correlation coefficient relative error – HP 39g Graphing Calculator User Manual
Page 111
Attention! The text in this document has been recognized automatically. To view the original document, you can use the "Original mode".
Fitting a curve to 2VAR data
In the Plot view, press HD. This draws a curve to fit the
checked two-variable data sei(s). See “To choose the fit” on
page
8
-
1 1
.
[?
lot
1
!§i=i;i!i
SQ
SYMB
Correlation
coefficient
Relative Error
H I N T
gSg|iT(ITI5TICS SVMEnUC VIEW^^
Cl . pj
cc
F i t l : 2.12195121951...
^S2: C3
C4
vFit2=itE^^Hi8MliBT
ENTEB USEE IiEFINED FIT____________
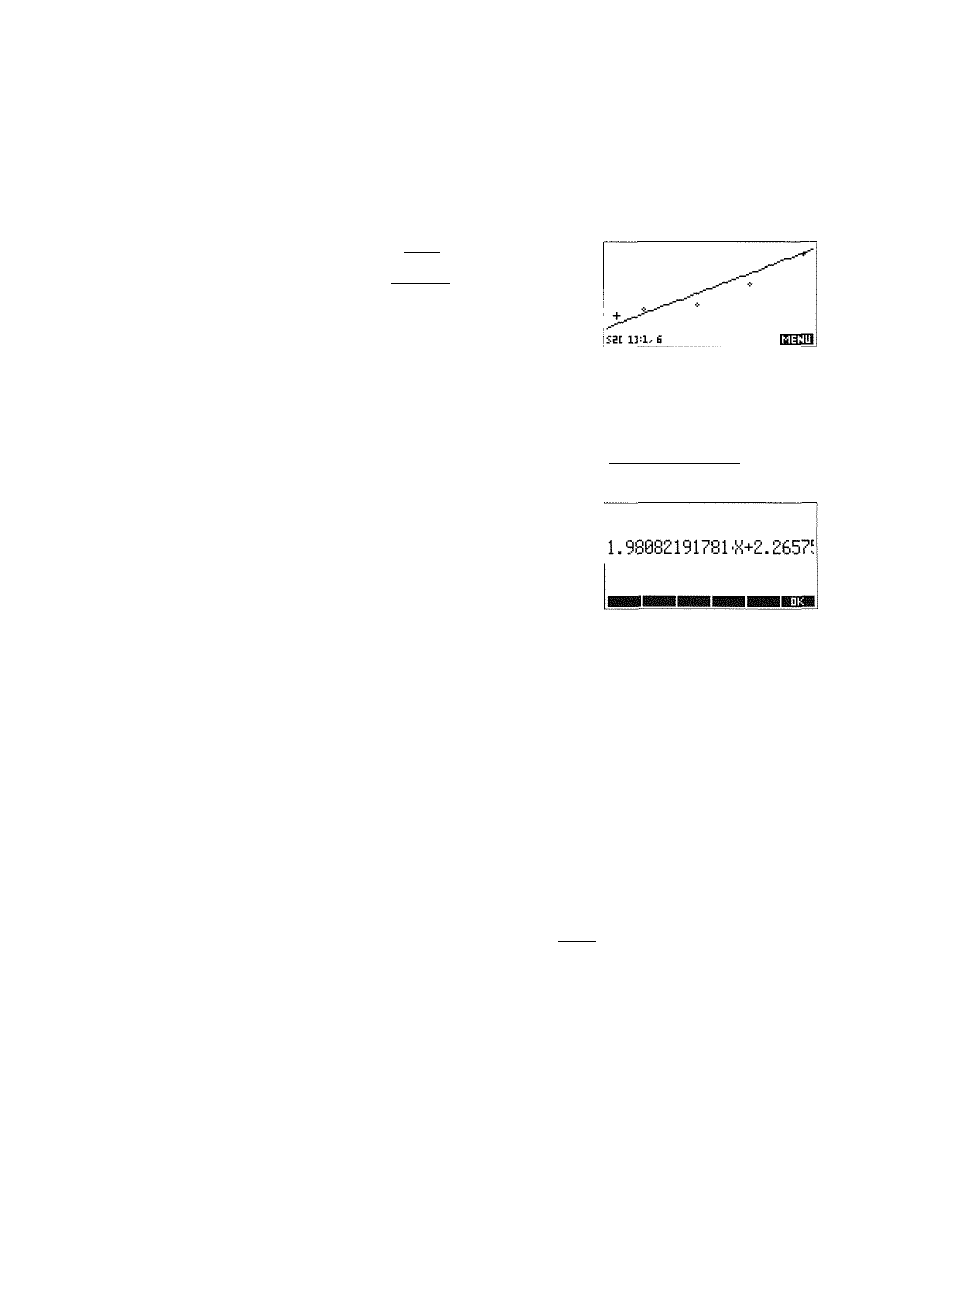
The expression in F i t 2
shows that the
slope=1.98082191781and
the 3'-intercept=2.2657.
The correlation coefficient is stored in the
CORK
variable. It is
a measure of fit to a linear curve only. Regardless of the Fit
model you have chosen,
CORK
relates to the linear model.
The relative error is stored in a variable named
RELERR.
The
relative error provides a measure of fit accuracy for all fits,
and it does depend on the Fit model you have chosen.
The relative error is a measure of the error between predicted
values and actual values based on the specified Fit. A smaller
number means a better fit.
In order to access these variables after you plot a set of
statistics, you must press |
num
| to access the numeric view
and then aMfj to display the correlation values. The values
are stored in the variables when you access the Symbolic
view.
Statistics aplet
8-17