Plot the graph, Draw the regression curve, Display the equation for best linear fit – HP 39g Graphing Calculator User Manual
Page 98
Attention! The text in this document has been recognized automatically. To view the original document, you can use the "Original mode".
Plot the graph
9. Plot the graph.
PLOT
Draw the
regression
curve
10. Draw the regression curve (a curve to fit the data points)
This draws the
regression line for the
best linear fit.
JBlIlDSHIBillilliifflBHIliBZni
Display the
equation for
best linear fit
11. Return to the Symbolic view.
SYMB
gj
statistic
;
svmehlic
view
^BI
v'Slilg—eg
F i 11: 425.875*li+376„.
S2:
F i 12: m-stX+b
¥
I ENTER IWDEPEWDEMT______________
li3TOI№lll5tMWiBWBKnngliIiniB|
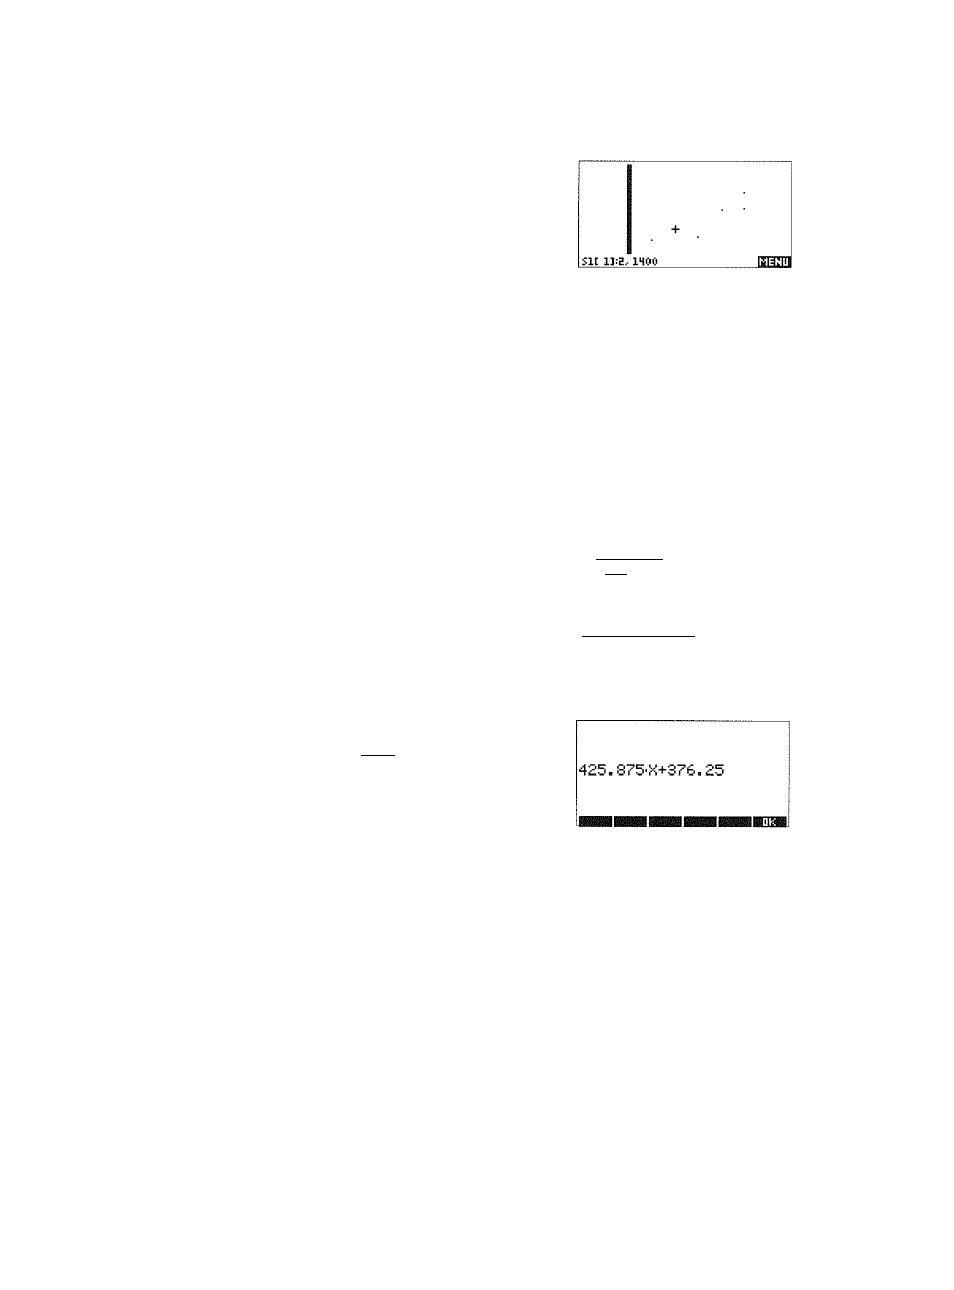
12. Display the equation for the best linear fit.
Q to move to the Fnl
field
The full FITl
expression is shown. The
slope (m) is 425.875.
The y-intercept (b) is about 376.25.
8-4
Statistics aplet
- iPAQ Glisten (185 pages)
- iPAQ Glisten-AT&T (185 pages)
- iPAQ rx5900 Travel Companion (10 pages)
- iPAQ h1900 Pocket PC series (127 pages)
- iPAQ hx2700 Pocket PC series (168 pages)
- QuickSpecs H5400 (13 pages)
- 620LX (172 pages)
- IPAQ H1930 (13 pages)
- 700 Series (204 pages)
- iPAQ h5150 (8 pages)
- Jornada 420 (146 pages)
- iPAQ PC h1910 (2 pages)
- HX2000 (11 pages)
- iPAQ hx2000 Series (3 pages)
- h4000 (141 pages)
- iPAQ HX2495b (10 pages)
- 820e (178 pages)
- 820 (186 pages)
- iPAQ h1910 (105 pages)
- iPAQ hx2790c (10 pages)
- IPAQ Pocket PC hx2110 (7 pages)
- rx3000 Series (301 pages)
- iPAQ hx4700 (169 pages)
- 2490 (14 pages)
- iPAQ hw6500 (170 pages)
- h6300 (190 pages)
- IPAQ HX2750 (9 pages)
- iPAQ h2200 Pocket PC series (125 pages)
- iPAQ Pocket PC h5400 Series (10 pages)
- Jornada 520 (134 pages)
- iPAQ h4100 Pocket PC series (143 pages)
- IPAQ H5100 (169 pages)
- h5400 (273 pages)
- IPAQ RX3000 (60 pages)
- H2200 (9 pages)
- UNIX AA-XXXXX-TF (15 pages)
- Jornada 540 Series (135 pages)
- PC Series (22 pages)
- 430se (151 pages)
- h1937 EN (127 pages)
- PrintCalc 100 (32 pages)
- PrintCalc 100 (33 pages)
- 48gII Graphing Calculator (892 pages)
- 48gII Graphing Calculator (864 pages)
- EliteBook 2740p Tablet-PC (179 pages)