Overlay plot, Display the numbers – HP 39g Graphing Calculator User Manual
Page 77
Attention! The text in this document has been recognized automatically. To view the original document, you can use the "Original mode".
Overlay plot
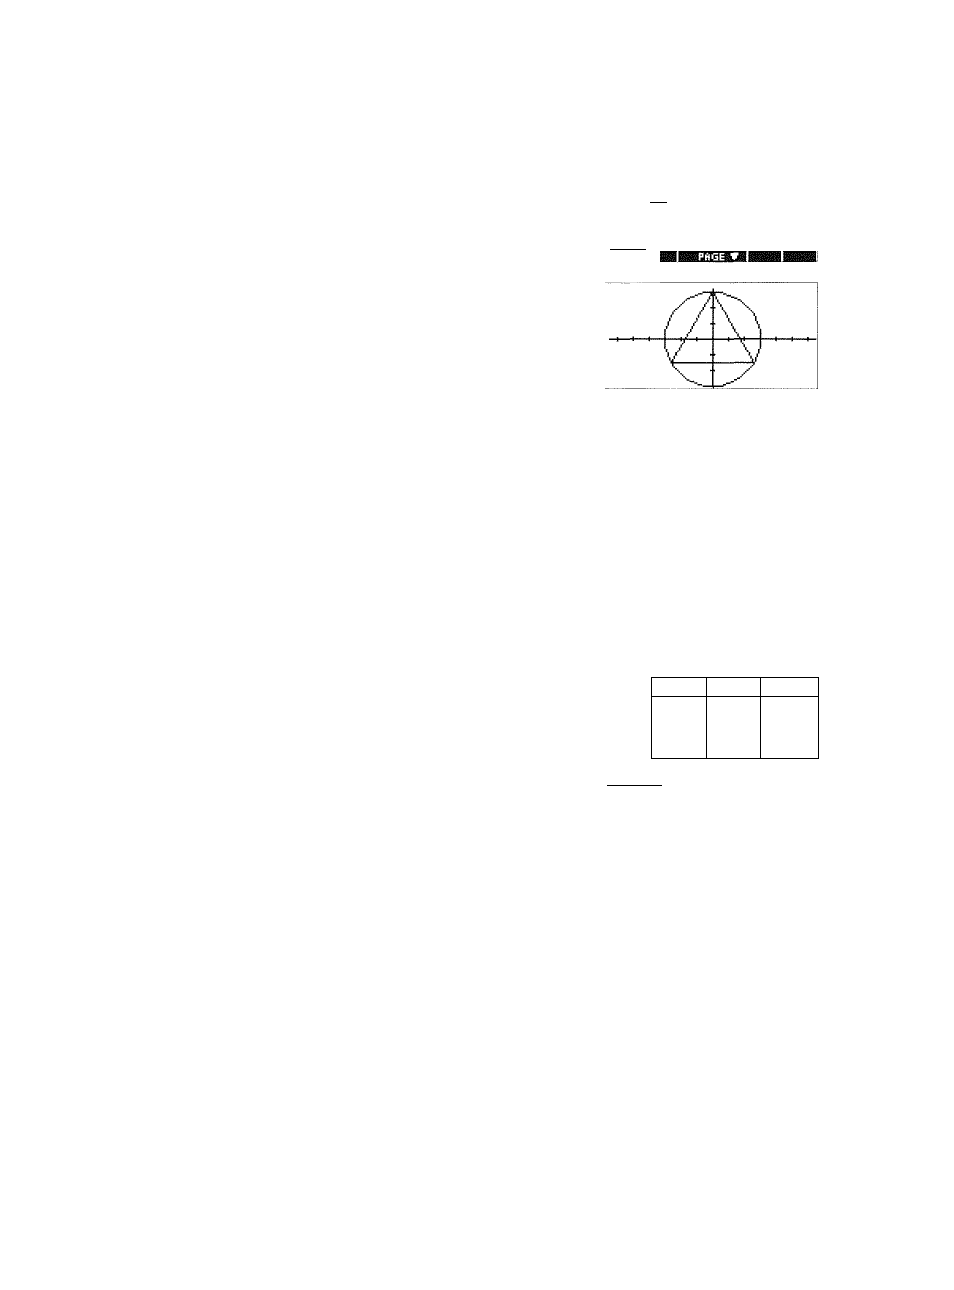
8. Plot a triangle graph over the existing circle graph.
SHIFT PLOT
a
1201
PflfilHMETFilC PLOT SETUPS®
TRNG: 0
360
TSTEP; 120
VRNS: -3. 1
3.2
ENTER MINIMUM HDRIZDNIRL VRLUE
joaiiH
VIEWS
Select
Overlay Plot
A triangle is displayed
rather than a circle
(without changing the
equation) because the changed value of TSTEP ensures
that points being plotted are 120° apart instead of nearly
continuous.
You are able to explore the graph using trace, zoom, split
screen, and scaling functionality available in the
Function aplet. See “Exploring the graph” on page 2-7
for further infonnation.
Display the
numbers
9. Display the table of numeric values.
NUM
You can see there is a
column of i-values.
81
VI
0
.OOSiSg
.oioH?a
.015?0?R
.OSCnHSB
.(fS6l?Ц6
3
a.'i'iq'iBa
a.'i'i'i'is'i
a.'iiqia?'
a.i^qqBBg
0
WmiSIl
IBHEB0B33B
This column is active in
the sense that you can
highlight a f-value, type in a replacement value, and see
the table jump to that value. You can also zoom in or
zoom out on any i-value in the table.
You are able to explore the table using
build your own table, and split screen functionality
available in the Function aplet. See “Exploring the table
of numbers” on page 2-18 for further information.
Parametric aplet
4-3