Choose fit and data columns, Explore statistics, Setup plot – HP 39g Graphing Calculator User Manual
Page 97
Attention! The text in this document has been recognized automatically. To view the original document, you can use the "Original mode".
Choose fit and
data columns
4. Select a fit in the Symbolic setup view,
ISHIFfl SETUP^SYMB
Select
Linear
iSUisTfiTisTics svMeoLic
setup
®
fiMSLE MEESUEE: Radians
siFiT^IBB^ai sEFiT^Linear
sEFinLinear SHFiT:Linear
SBFmLinear
CHUnSE STATISTICS MDOEL TVPE
BHBignnitgBB
Explore
statistics
You can define up to five explorations of two-variable
data, named SI to S5. In this example, we will create
just one:
SI.
5. Specify the columns that hold the data you want to
analyze.
SYMB
You could have entered
your data into columns
other than C1 and C2.
HSSTfillSTICS SVMEDLIC MIEW^
S2:
F i 12:m*X+b
EMTEB IHDEPEHPEHT________________
6.
Find the mean advertising time
(MEANX)
and the mean
sales
(MEANY).
|NUM|
a-VAR
SI
MEANX
is about 3.3
minutes and
MEANY
is
about $1796.
MEANH
ika
MEANY
EY
iva
ipill
BO
17R5.B33
10??5
aasBBras
^^3333333333^^^^^
Setup plot
7. Scroll down to display the value for the correlation
coefficient
(CORR)
. The
CORR
value indicates how well
the linear model fits the data.
[
t
1 9 times
The value is 0.8995 to
four significant digits.
a-VAR
SI
2va
IRY
SCDY
PCDY
CORR
RELERR
aa33B7as
H1S35
1135.BE?
3HS.3BB3
,899530938561
Change the plotting range to ensure all the data points are
plotted (and select a different point mark, if you wish).
\SYWfY\SEWP-PLOT
0 7 I
ENTER
I
[FTI 100 I
ENTER
I
4000 I
ENTER
I
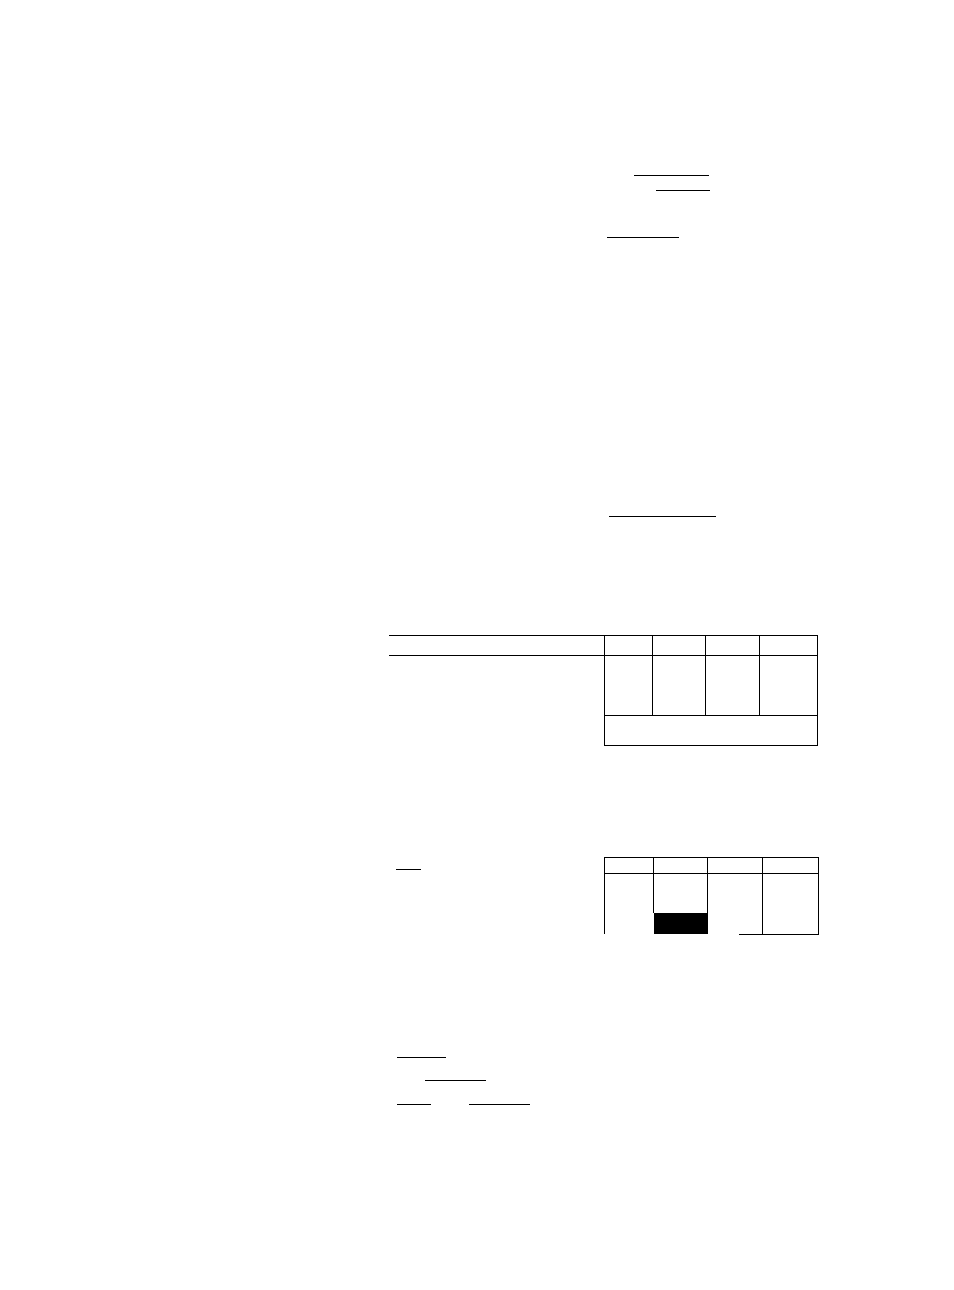
S»STftTISTICS PLOT SETUPS*
KRNG: -2
7
VRNG: -100
4000
SHMARK:” S5HRRK:K
CHDQSE HARK FDR SCATTER PLOT
Statistics aplet
8-3