Example: plotting a circle, Iaaiaragna^mb, 0[yz][x3q[lhhi – HP 39g Graphing Calculator User Manual
Page 62: Example: plotting a circle -21, Select, V g] 9, Im isfirfl v g] 9 0[x70, Display the functions in numeric form
Attention! The text in this document has been recognized automatically. To view the original document, you can use the "Original mode".
Example: plotting a circle
Plot the circle, x^+
= 9. First rearrange it to read
,y = +./
9
-/ .
To plot both the positive and negative >’ values, you need to
define two equations as follows:
y = J
9
-x~ and y =
1. In the Function aplet, specify the functions.
IAPLET i
Select
Function Ft* III ill
SHIFT
]V G] 9
B
functidn
symedlic
views
-'F100=-r<9-X=>
v'F2
F4
F5
iaaiaRagna^MB
0[yZ][x3Q[lHHI
im isFirfl V G] 9
0[x70]
[
0
Q]G^
2. Reset the graph setup to the default settings.
SHIFT SfiFi/F-FLOr
SHIFT Ci,£/l/i
■ FUNCTIDN
PLOT SET
KRNij:
■ 6.5
YFiNG:
-3.1
3.2
HTICK:
1
YTICK: 1
RES:
Detai1
ENTER MINIMUH
HDRI^QHTAL VALUE
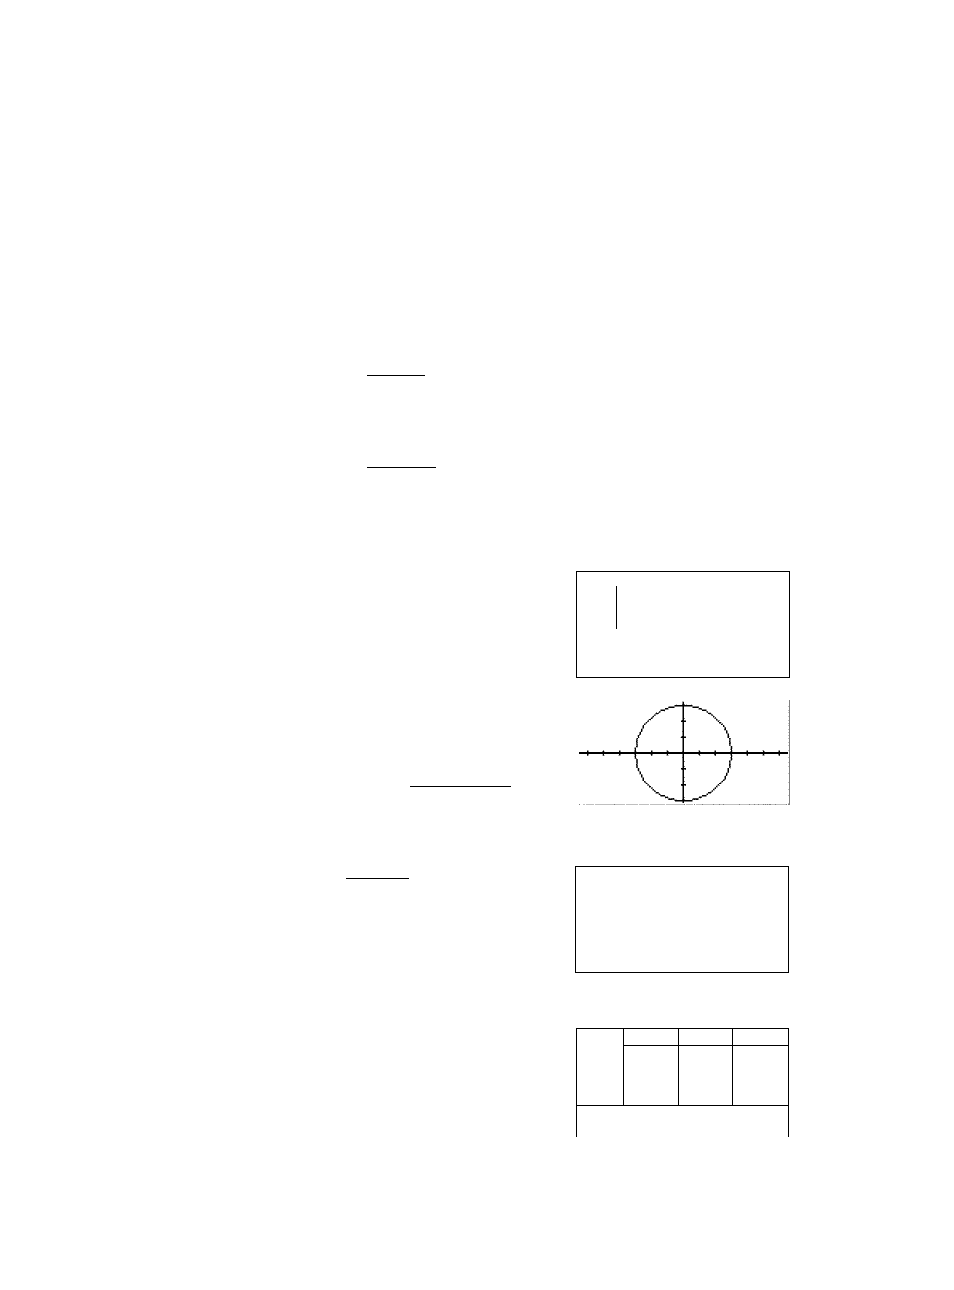
3. Plot the two functions
and hide the menu so that
you can see all the circle.
|pinT|iBiii:i!iraii;pi
4. Reset the numeric setup to the default settings.
ISHiFTligTOP-yt/M
SHIFT CZ.£/iR
^^FUNCTION NUMERIC SETUP^^
NUMSTART:
iSBHBRI
NUMSTEP:
.
1
NUMTYPE:
Automat ic
NUMZQOM:
4
ENTER STARTING VALUE FOR TARLE
Bwaiaa—
BaMiBmCTiiHHgM
5. Display the functions in numeric form.
NUM
X
Ff
F2
3
a.33B333
-3
-3.33833
.a
a.3>i33a6-a.33333
.3
a.BBHBEa-a.3BH3fi
.H
a.BPaaiH-a.37331
.5
a.BSBOH -E.35BCIH
2-20
Aplets and their views