Drucker Diagnostics Paralens Advance User Manual
Page 21
Section 1
Introduction
3.1.7 Data Acquisition
Test data is read via a 12-bit analog-to-digital
converter. A typical tube assay consists of the
following:
a.
Forward and reverse transmittance and
fluorescence scans of entire tube to determine
tube type, float length, fill volume, etc.
b. One fluorescence scan of float region in forward
direction, with red filter in place.
c. One fluorescence scan of float region in reverse
direction, with green filter in place.
d. Tube is indexed 45° axially in carriage, and
fluorescence scans of b and c are repeated.
The above process is then repeated until eight
sets of fluorescence scans are made around the
circumference of the tube and float.
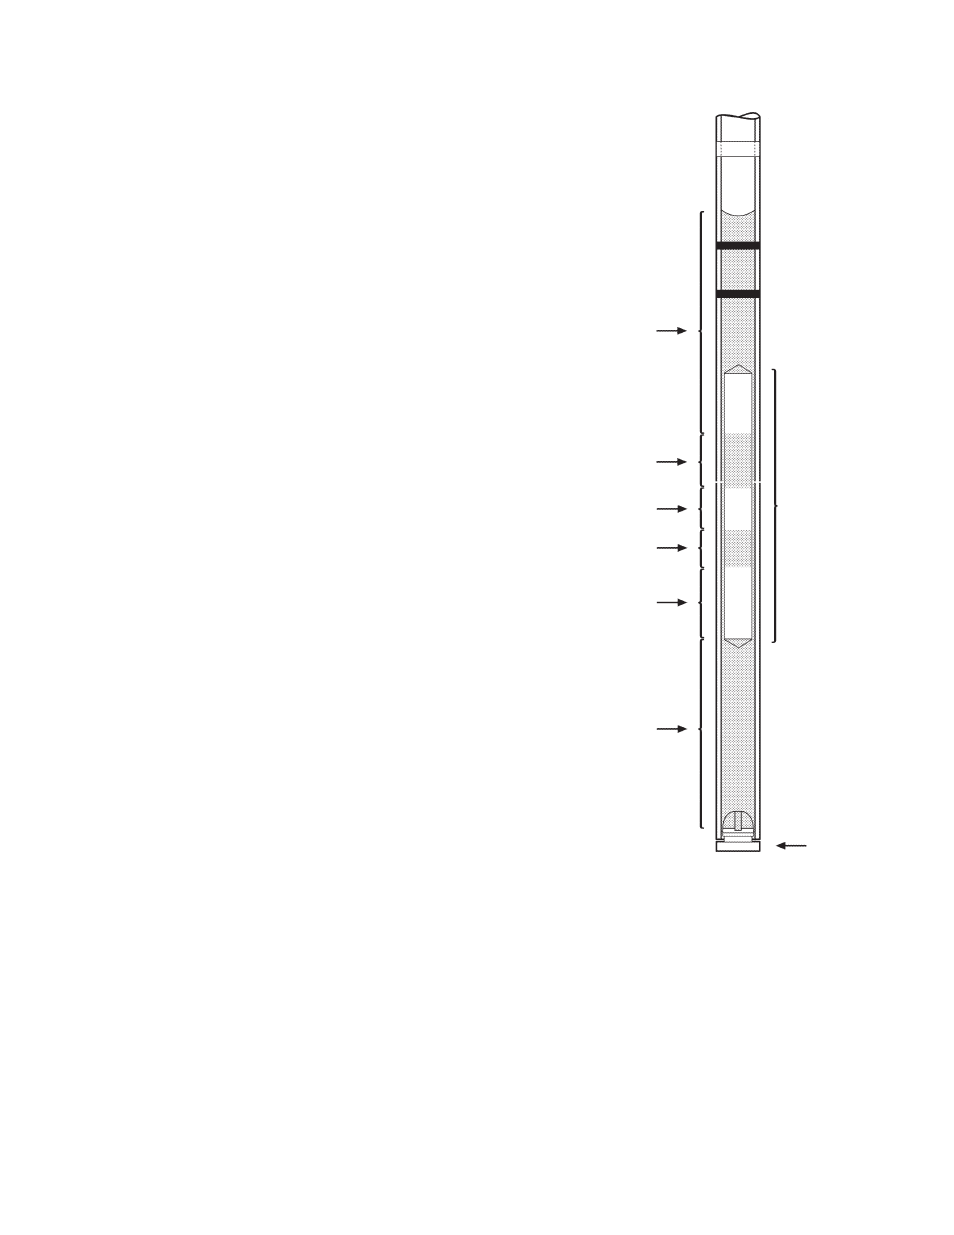
The microprocessor computes packed cell volumes
(and resulting test values) from linear measurements
of the color-differentiated packed cell layers shown
in Figure 3-12. QBC tube parameters are thus a
function of the following lengths:
• Hematocrit:
L
1
• WBC:
L
3
and L
4
• GRANS:
L
3
• LYMPH/MONO: L
4
• Platelet Count: L
5
• Hemoglobin:
Derived from L
1
, L
2
, L
3
, L
4
,
and L
5
The L
6
plasma column is also measured to determine
the actual fill volume, which is between 65-75 µL for
a QBC AccuTube. Data processing incorporates
various digital filter, pattern recognition, and data
conversion algorithms. The latter computations
are based on the fact that each QBC tube exhibits
a characteristic signature that must fall within
prescribed tolerances.
Bandlength data from the eight pairs of scans made
around the blood tube are analyzed and processed.
Test readings are displayed only when data analysis
confirms valid bandlengths in at least four sets of
scanning measurements.
Figure 3-12.
Packed Cell Layers in QBC AccuTube
3-6
FLOAT
STOPPER
L
6
L
5
L
4
L
3
L
2
L
1