INFICON SQM-242 Thin Film Deposition Controller Card Operating Manual User Manual
Page 95
9 - 9
IP
N 07
4-
54
9-
P1
A
SQM-242 Operating Manual
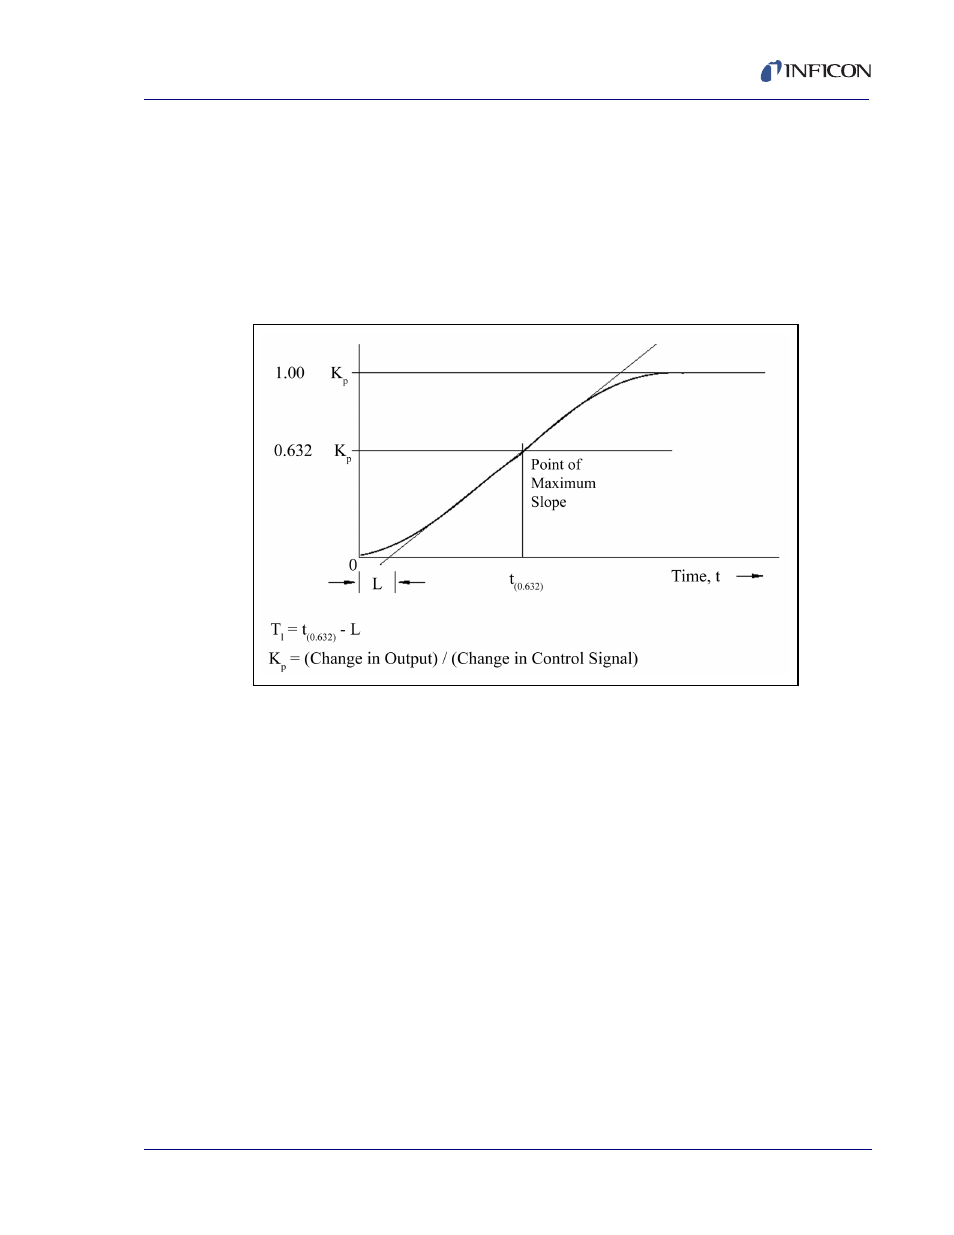
Three parameters are determined from the process reaction curve. They are the
steady state gain, K
p
, the dead time, L, and the time constant, T
1
. Several methods
have been proposed to extract the required parameters from the system response
as graphed in
Figure 9-7
. These are: a one point fit at 63.2% of the transition (one
time constant); a two point exponential fit; and a weighted least-square-exponential
fit. From the above information a process is sufficiently characterized so that a
controller algorithm may be customized.
Figure 9-7 Response of Process To An Open Loop Step Change
(At t=0 Control Signal is Increased)
A controller model used extensively is the PID type, shown in Laplace form in
equation [11]
.
[11]
Where
M(s) = manipulated variable or power
K
c
= controller gain (the proportional term)
T
i
= integral time
T
d
= derivative time
E(s) = process error
Figure 9-8
represents the controller algorithm and a process with first order lag plus
a dead time. The process block implicitly includes the dynamics of the measuring
devices and the final control elements, in our case the evaporator power supply.
M s
K
c
1
1
T
i
s
------- T
d
s
+
+
Es
=