2 fft preferences – Campbell Scientific ID-2000W Software User Manual
Page 71
SECTION 7. PREFERENCES
7-7
ID-2000 always plots data on this memory
image. If you check the “Trace Update” box ID-
2000 will simultaneously plot data on both the
memory image and the display screen. This
allows you to see the plot as it is being created
but reduces performance due to ID-2000 having
to draw twice as many lines. If you uncheck the
box then ID-2000 will only plot on the memory
image and at its completion copy the image to
the display. This is the fastest plotting method
although you will not see anything until the plot
is completed on the memory image.
Both of these controls default to a checked
condition.
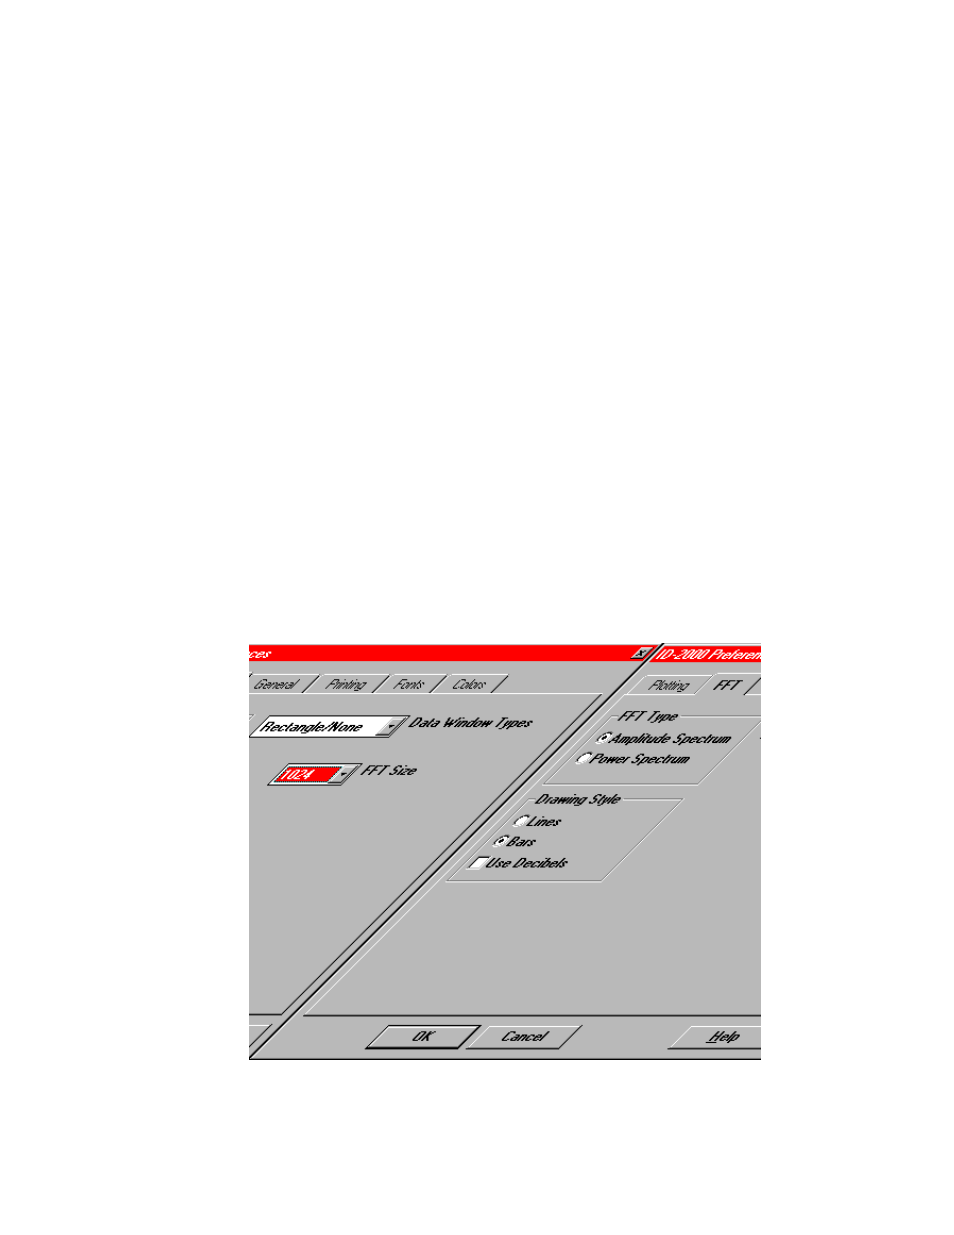
7.2 FFT PREFERENCES
The FFT tab dialog is shown in Figure 7-7.
The FFT dialog is fairly simple with only a few
controls. The FFT Type group contains two
radio buttons for selecting the type of FFT plot.
The two types are Amplitude Spectrum and
Power Spectrum.
An amplitude spectrum plots the amplitude of
the signal at each frequency. A power
spectrum plots the amount of signal power
generated at each frequency.
The Drawing Style group allows you to specify
whether the FFT plot should be made using
lines between the points (like a non-FFT plot) or
bars (like a bar graph). You may also specify to
display the Y-axis values in decibels. A decibel
is defined as 20 times the log base 10 of the
amplitude or power.
Data windowing is a technique used for
modifying the data prior to FFT calculation in
order to accent the results. The types of data
windowing available are:
•
Rectangle or None
•
Exact Blackman
•
Hamming
•
Hanning
•
Parzen
•
Welch
To select a data windowing type click the down
arrow which will drop down the list of available
choices from which to choose.
FIGURE 7-7. FFT Preferences