Campbell Scientific ID-2000W Software User Manual
Page 20
SECTION 1. THE BASICS
1-10
We are now going to make an X-Y plot of
“FanSpeed” versus “TurbineSpeed”. We will
only be plotting one graph this time so turn off
the second graph (remove the check on the
second row in the “On” group). Change the X-
axis parameter on the first graph to
“FanSpeed”. (Click on the first button under the
X column and then select the “FanSpeed”
parameter in the Parameter Selection dialog.)
Now change the Y-axis parameter to
“TurbineSpeed”. The last thing we need to do is
to change the plot type from Strip-Chart to X-Y.
(Just click on the “X-Y” radio button on the Plot
Type row.)
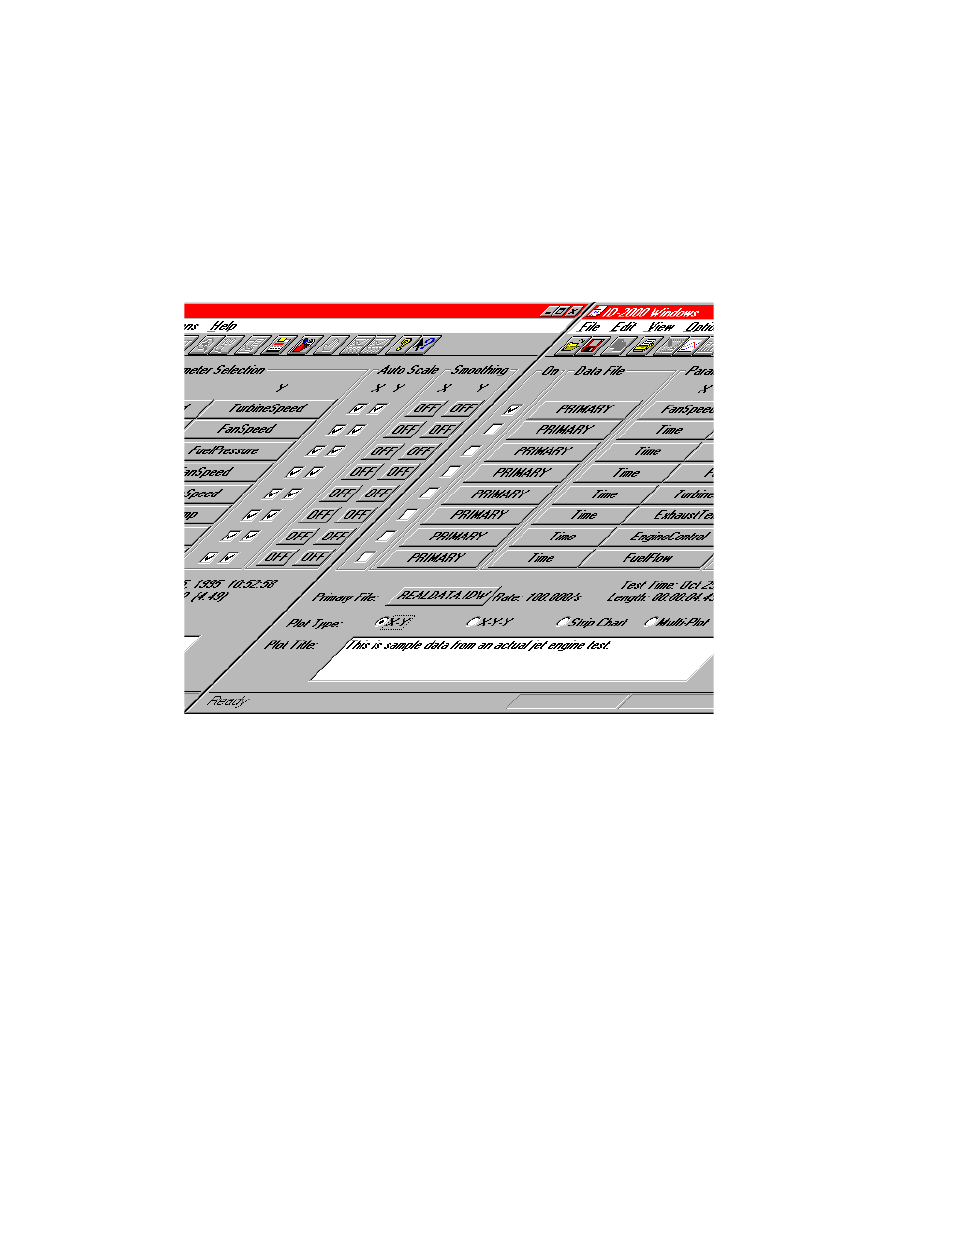
Your Plot Template window should look like
Figure 1-9.
FIGURE 1-9. Plot Template for FanSpeed versus TurbineSpeed