Campbell Scientific ID-2000W Software User Manual
Page 37
SECTION 3. PLOT TEMPLATE VIEW
3-5
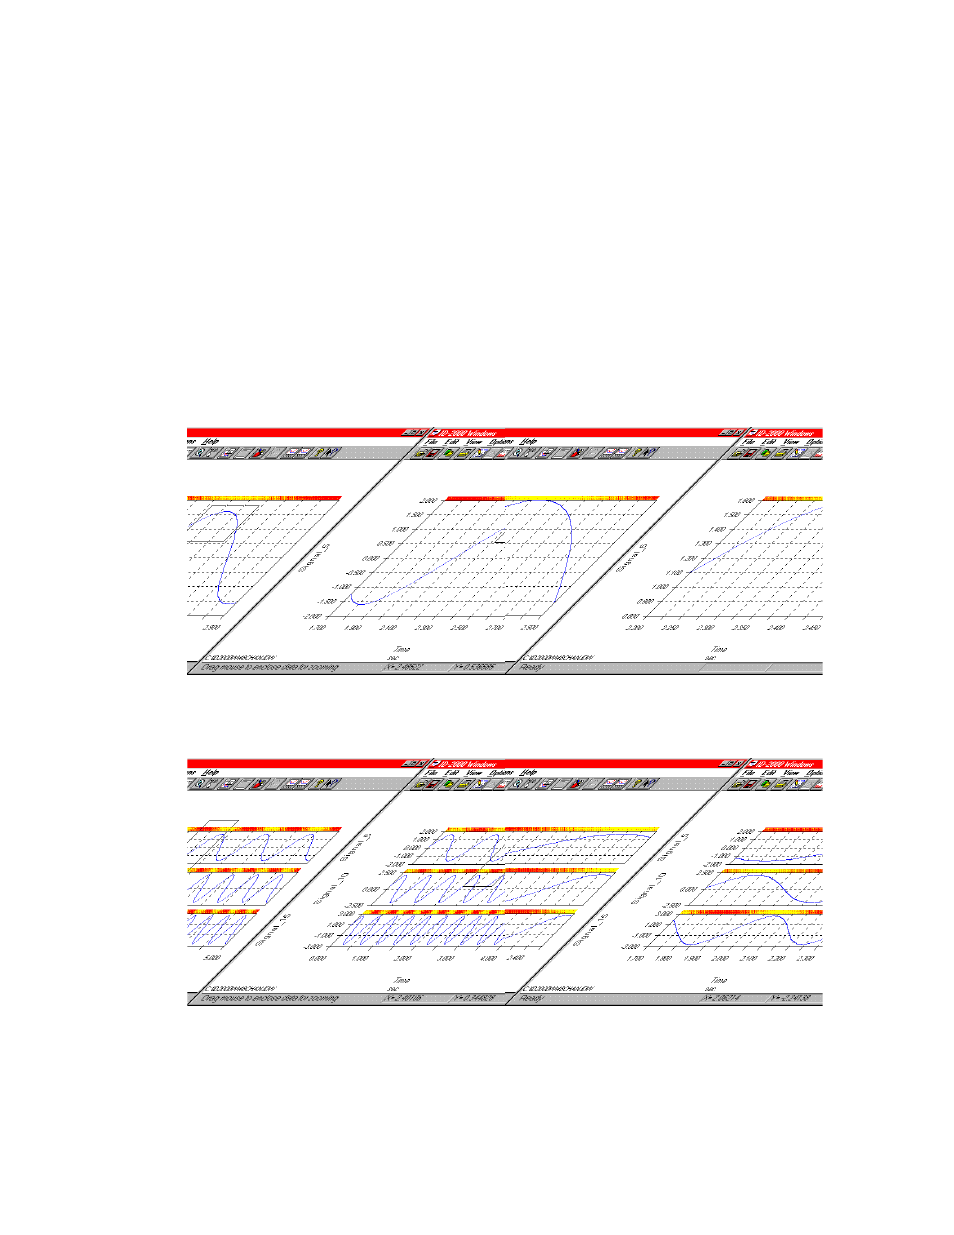
Take a look at the left view in Figure 3-6 and
you’ll see that our zoom rectangle goes from
about 2.2 to 2.5 seconds horizontally and about
0.5 to 1.75 vertically. Now look at the right view
and you will see that the new plot is scaled from
2.2 to 2.5 for the X-axis. Although our zoom
rectangle went from 0.5 to 1.75 the new plot
was scaled from 0.8 to 1.6 which is the data
value range of Signal_5 between 2.2 and 2.5
seconds.
Autoscaling only affects zooming when it is
enabled and the X-axis parameter is Time,
Reference Time, or Scan_Number. Any other
conditions results in both the height and width of
the zoom rectangle being used to determine the
new scales.
If your Strip Chart plot has multiple graphs on it
as in Figure 3-7 you still zoom the same way.
The height of the zoom rectangle doesn’t matter
- in fact the rectangle doesn’t even have to
extend through all graphs. It is only the width of
the rectangle that matters as long as
autoscaling is enabled and the X-axis
parameter is Time, Reference Time, or
Scan_Number.
FIGURE 3-6. Zooming Closer
FIGURE 3-7. Zooming Multiple Strip Chart Graphs