1 selecting parameters, 2 derivatives and integrals – Campbell Scientific ID-2000W Software User Manual
Page 27
SECTION 2. PLOT TEMPLATE VIEW
2-5
Y-axis parameter respectively. These buttons
are used to either select a different parameter
(left mouse button) or to edit the plot scales for
the parameter (right button).
FIGURE 2-9. “Parameter Selection” Group
2.3.1 SELECTING PARAMETERS
To change either the X or Y axis parameter use
the left mouse button to click on the appropriate
parameter button. This will display the
Parameter Selection List dialog box shown
below in Figure 2-10.
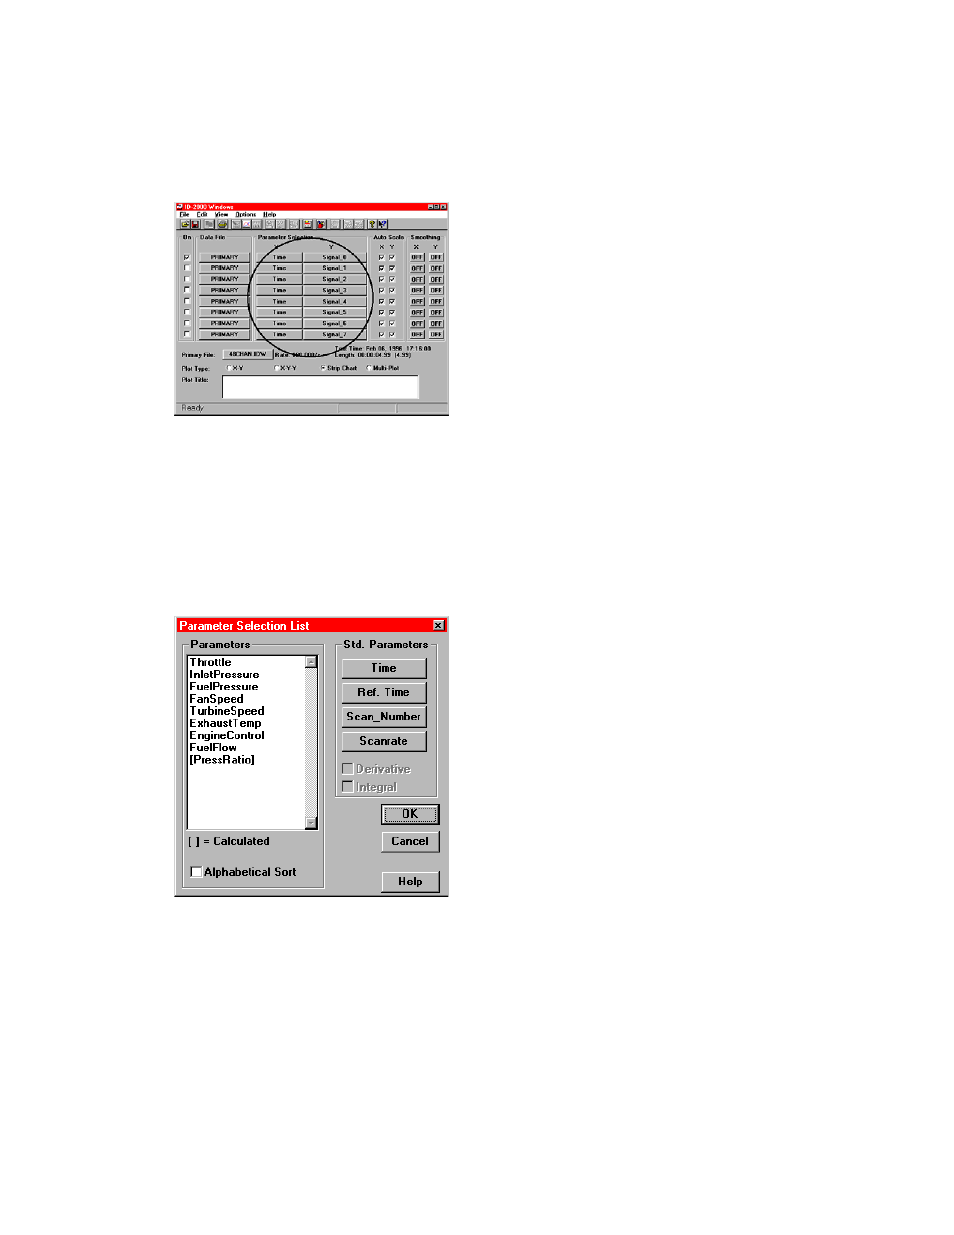
FIGURE 2-10. Parameter Selection List
Dialog
The Parameter Selection List contains a list of
all parameters contained in the data file as well
as some “standard” parameters which are
available for every data file.
The Parameter Selection List dialog box is
basically the same for selecting either X or Y
parameters. However, there are a few
differences. When selecting an X parameter
the derivative and integral check boxes are
disabled. You may not plot a derivative or
integral on the X axis. When selecting a Y
parameter the “Time” and “Ref. Time” buttons
are disabled. You may not plot time or
reference time on the Y axis.
The list inside the group labeled “Parameters” is
the actual list of parameters for the data file. If
the check box “Alphabetical Sort” is enabled
then the list is sorted alphabetically. Otherwise,
the parameters are listed in the same order as
they are found in the data file.
Any parameters enclosed in brackets “[ ]” are
calculated parameters and are not part of the
original data file. These are parameters that
you can create in ID-2000 which are appended
to the original data. You may add, edit, or
delete calculated parameters which will be
discussed later in this manual. You may never
modify any of the original parameters.
On the right side of the Parameter Selection List
dialog is a group labeled “Std. Parameters”. In
this group are buttons labeled “Time”, “Ref.
Time”, Scan_Number”, and “Scanrate”. These
parameters are available for plotting on any
data file regardless of what parameters it may
contain.
2.3.2 DERIVATIVES AND INTEGRALS
At the bottom of the “Std. Parameters” list are
two check boxes labeled “Derivative” and
“Integral”. Checking one of these boxes allows
you to plot either the derivative or integral of one
of the data file parameters. You cannot plot a
derivative or integral of one of the standard
parameters (Time, Ref. Time, etc.). A
derivative is the rate of change for a parameter
relative to time or how fast the parameter value
is changing. A integral is sort of the opposite of
a derivative in that it is the total amount of
change over time.
Let’s say you had a data file of a race car and
one of the parameters in the file was “SPEED”
which represents car speed in miles per hour.
You could plot the derivative of SPEED which
would show you the acceleration of the car (how
the speed is changing over time). You could
also plot the integral of SPEED which would
show you how many miles the car was driven.