Campbell Scientific ID-2000W Software User Manual
Page 16
SECTION 1. THE BASICS
1-6
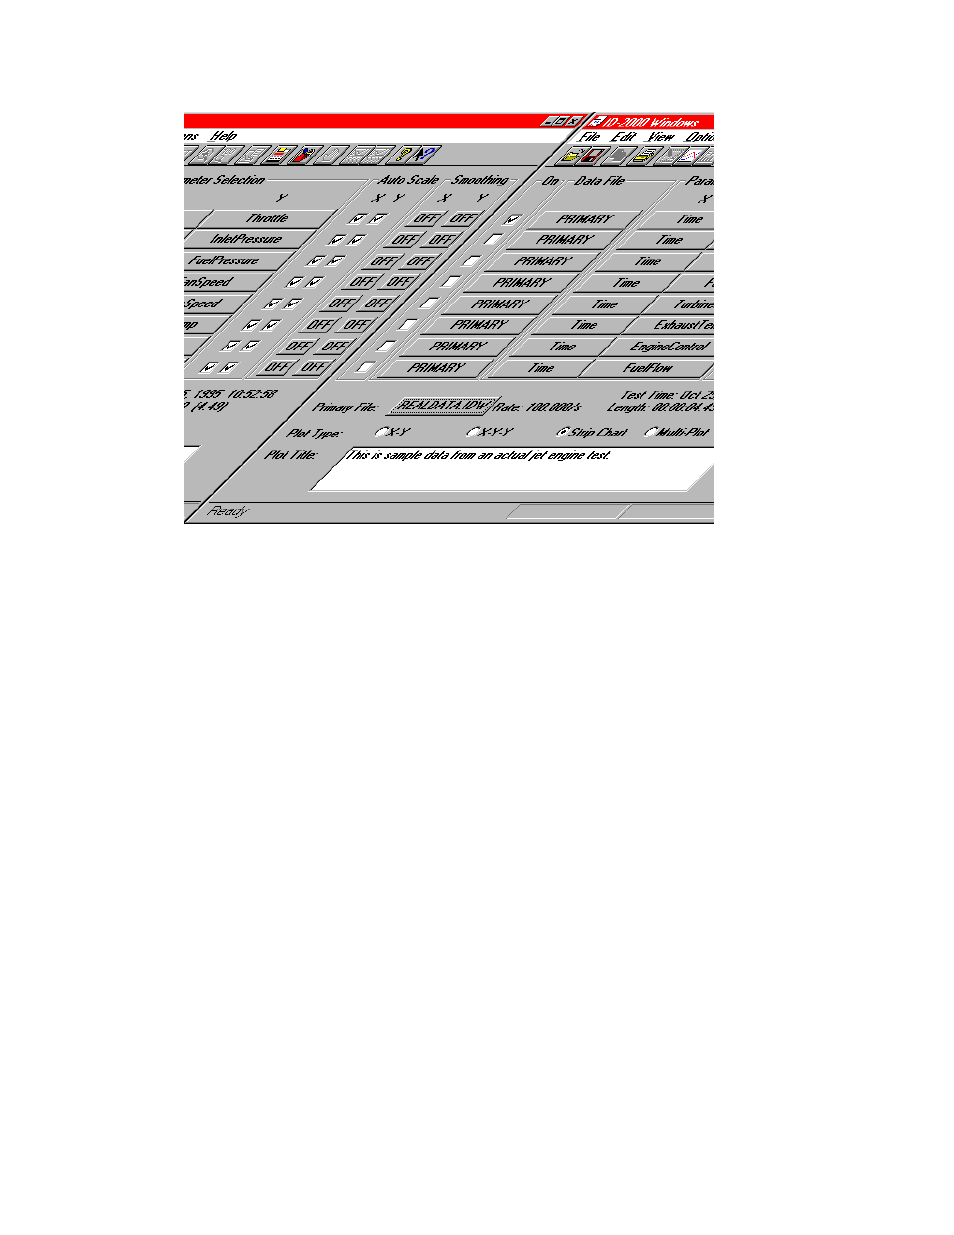
FIGURE 1-5. Plot Template of REALDATA.IDW
The Plot Template view should change to look
similar to that in Figure 1-5.
Now let’s make a Strip Chart plot. We will have
two strips (or graphs) on our plot. The first
graph will be “ExhaustTemp” parameter versus
“Time”. The second one will be “FanSpeed”
versus “Time”.
If you look at Figure 1-5 you will see groups or
columns labeled “On”, “Data File”, “Parameter
Selection”, “Auto Scale”, and “Smoothing”.
There are eight rows of items in each group.
Each row represents one graph or strip. We
want to plot two strips so we will be working with
the first two rows only.
Look at the first row in Figure 1-5. The boxes in
the “On” group are called “check boxes” and
allow you to turn a feature on or off by
“checking” or “unchecking” the box. The box is
checked when it contains either an “X” or “
√
”
inside. To check or uncheck it just click the
mouse in it which will toggle it back and forth.
We want to turn the first graph on so check the
box on the first row now.
Continue across on the first row to the group
labeled “Data File”. The button label should say
Primary. This button is used to specify what
data file (other than the primary file) you wish to
use. We won’t change this now but will discuss
it later in the manual.
The next group is labeled “Parameter Selection”
and contains a column of buttons under the “X”
label and another column under the “Y” label.
The names on these buttons are the
parameters that are selected for the X-axis and
Y-axis of your plot.