Section 3. plot view – Campbell Scientific ID-2000W Software User Manual
Page 33
3-1
SECTION 3. PLOT VIEW
The Plot view contains the graphs that you
defined in the Plot Template view. In this view
you can zoom in and out on data sections,
annotate the plot with notes and leaders, view
data statistics, save and recall plots, send the
plot to your printer, and much more. The Plot
view is where you will do the majority of your
data analysis. There are many tools that ID-
2000 provides for the Plot view which we will
discuss in this chapter.
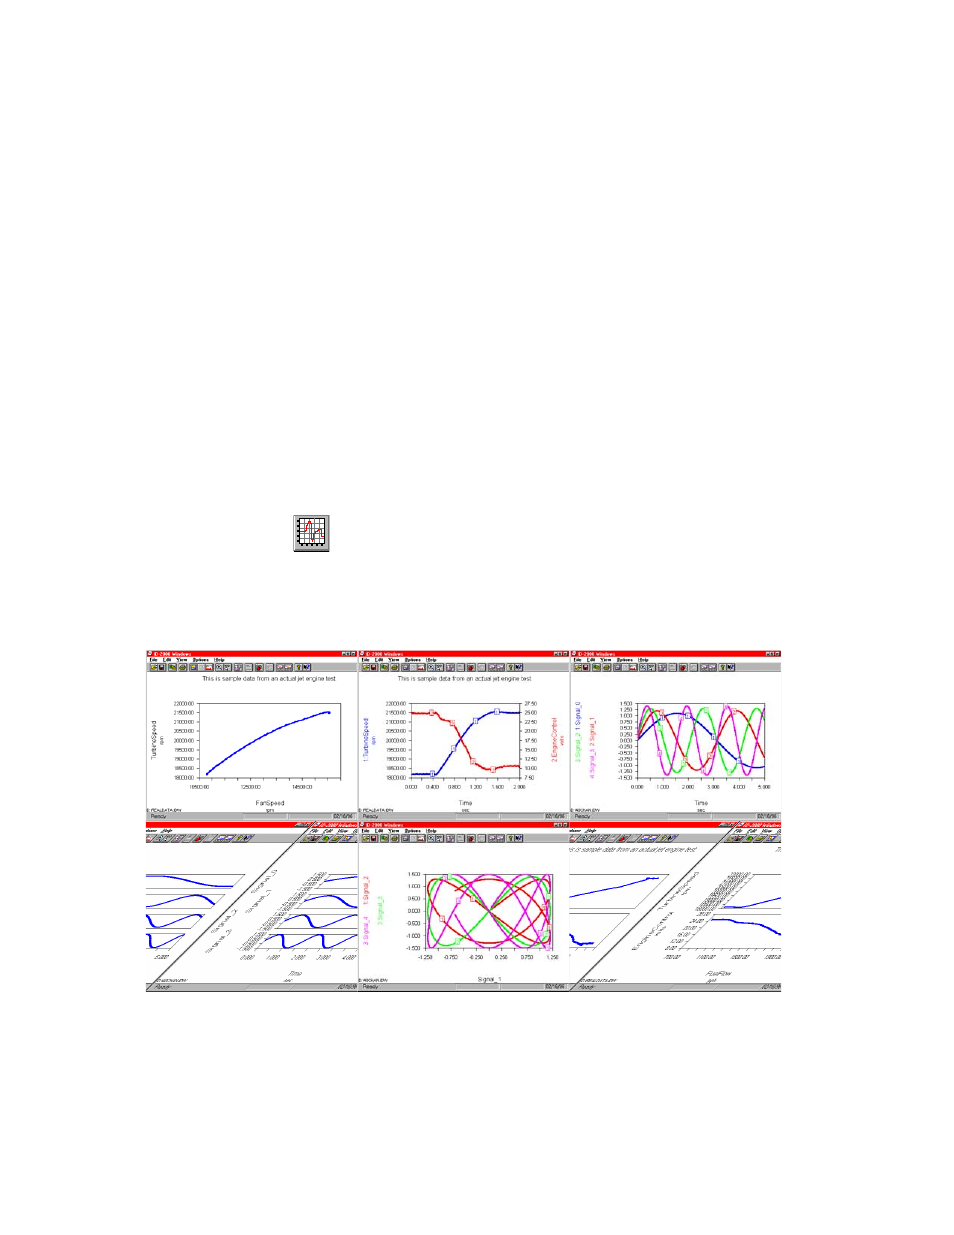
Figure 3-1 illustrates samples of Plot views
corresponding to various Plot Template
settings.
You access the Plot view from the other views by
clicking the toolbar button, selecting the View-
Switch To Plot menu item, or by pressing F3.
There are many ID-2000 settings that can be
adjusted which affect how the Plot view looks
and acts. Some of these settings will be
discussed in this chapter. Please refer to the
Preferences chapter for a complete description
of these settings.
The Plot view is divided into several areas. The
center section contains the graph(s) of the
parameters you selected in the Plot Template.
In the case of a Strip Chart style plot the first
graph is at the top and the last graph at the
bottom. The X-axis is always horizontal and is
labeled at the bottom of the plot. All graphs use
a common X-axis. Y-axes are vertical and
labeled on either the left or right side of the
graphs. You may have one common Y-axis or
individual Y-axes depending upon what plot type
you selected.
As you move the mouse through one of the
graphs you will see the coordinates of the
cursor on the status bar at the bottom of the
window. These coordinates are only visible
while the mouse cursor is actually inside a
graph.
FIGURE 3-1. Plot Views for Various Plot Template Settings