4 "auto scale" group, 5 "smoothing" group – Campbell Scientific ID-2000W Software User Manual
Page 29
SECTION 2. PLOT TEMPLATE VIEW
2-7
If you change the MIN or MAX scale ID-2000
will automatically switch the graph over to
manual scaling so that it will use your scale
values instead of automatically calculating
scales based upon the plotted data values.
On the right of the dialog box is a group labeled
“Data Subset”. This group allows you to control
how much of the data file is actually plotted.
Let’s take an example of a very large data file
that was recorded at a scanrate of 1000 (1000
scans per second) for 1000 seconds (about 16
minutes). This data file would have 1,000,000
readings of every parameter in it. Obviously this
would be a big data file and would take a while
to plot the entire file. Perhaps you have already
looked at the data or know from the comments
in the data file that the part you are primarily
interested in looking at is only the data between
the time of 450 and 475 seconds. You could of
course plot all 1000 seconds of data and then
zoom in on the section between 450 and 475
but that would mean you would have to wait for
all 1,000,000 data points to be plotted first.
Instead you could enter a value in the “Time
Start” field of 450 and “Time Stop” field of 475
which would only plot the data for those 25
seconds. This would be much faster than
waiting for the entire file to be plotted.
If you press the “Full Time” button the start and
stop times will be defaulted to the entire length
of the data file so that every point is plotted.
You may also check the “Set times for all
graphs” box if you want all eight graphs to use
the same start and stop times.
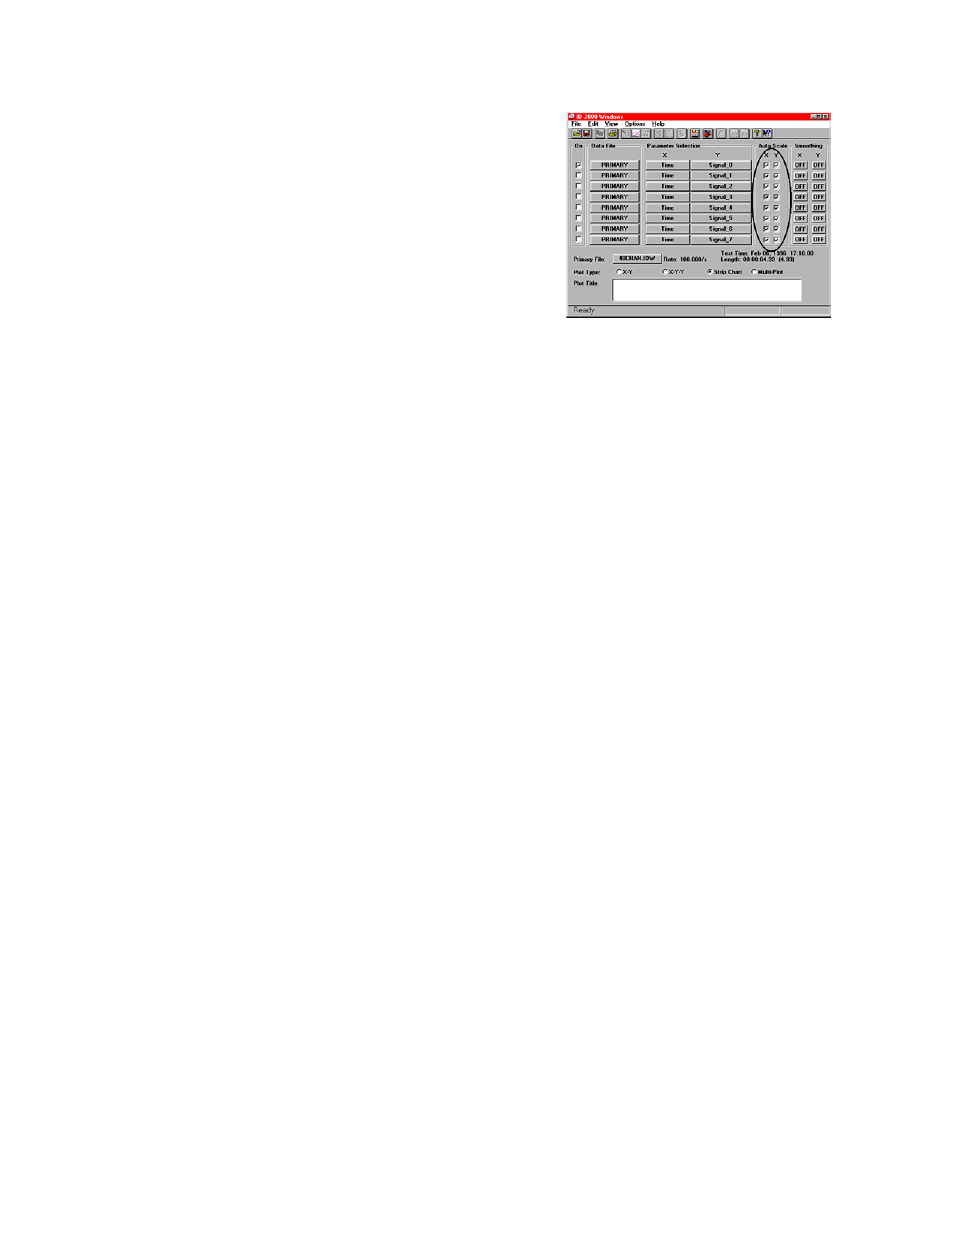
2.4 “AUTO SCALE” GROUP
Farther to the right in the Plot Template view is
a group labeled “Auto Scale” with two columns
of check boxes labeled X and Y (Figure 2-12).
FIGURE 2-12. “Auto Scale” Group
By default, ID-2000 automatically scales the
plots you create based upon the value of the
data that is being plotted. With autoscaling you
never have to worry about having a plot with
scales of 0 and 10 when the parameter being
plotted only varies between 0.5 and 0.75. ID-
2000 will calculate the best scales to use so that
the parameter takes up the largest part of the
plot.
Sometimes it is advantageous to turn
autoscaling off. This may be the case if you are
printing many plots from various data files and
you want the scales on all the plots to be the
same. To turn autoscaling off remove the X in
the check box under the appropriate X or Y
column and then right click on the appropriate
Parameter Selection button to type in your
scales. (See the previous paragraph on how to
edit scales for a parameter.)
2.5 “SMOOTHING” GROUP
To the far right side of the Plot Template is a
group labeled “Smoothing” (Figure 2-13). Like
the Parameter Selection group it contains two
columns of buttons labeled X and Y that allow
you to specify what amount (if any) of data
smoothing is to be used when plotting a graph.