Campbell Scientific ID-2000W Software User Manual
Page 69
SECTION 7. PREFERENCES
7-5
Grid:
Check this box if you wish to display the
background grid on each graph.
Plot Title:
At the top of the plot is space reserved
for three lines of text that may be
entered in the Plot Title group in the
Plot Template view. If you do not have
a plot title or prefer to not display it you
can disable this feature which will also
make more room on the plot for each
graph.
Centered:
To the right of the Plot Title
check box is another check box
labeled “Centered” which is
only available if the Plot Title
box is checked. The default
alignment for the plot title is left
aligned along the far left side of
the graph. If the Centered box
is checked then each line of the
plot title will be center aligned at
the middle of the graph.
X-Axis Title:
Check this box if you wish to display the
X-axis parameter title. Normally you
would always want this feature enabled.
Y-Axis Title:
Check this box if you wish to display the
Y-axis parameter title. Normally you
would always want this feature enabled.
However, there may be circumstances
where disabling the Y-Axis title might be
advantageous. An example would be a
Multi-Plot where the same parameter
from eight different data files is being
plotted . With this feature enabled the
plotted parameter would be displayed
eight times for the Y-Axis title. This is
not only redundant but could
unnecessarily clutter the plot. A better
solution would be to turn off the Y-Axis
title and use a plot note or modified Plot
Title to identify the plotted parameter’s
name.
Parameter Units:
To display parameter units in the graph
axes check this box.
Data Track Rollup:
If this box is checked, the data track
rollup dialog will be displayed
immediately in the Plot or FFT view.
This feature may also be
enabled/disabled via the View - Track
Rollup menu item.
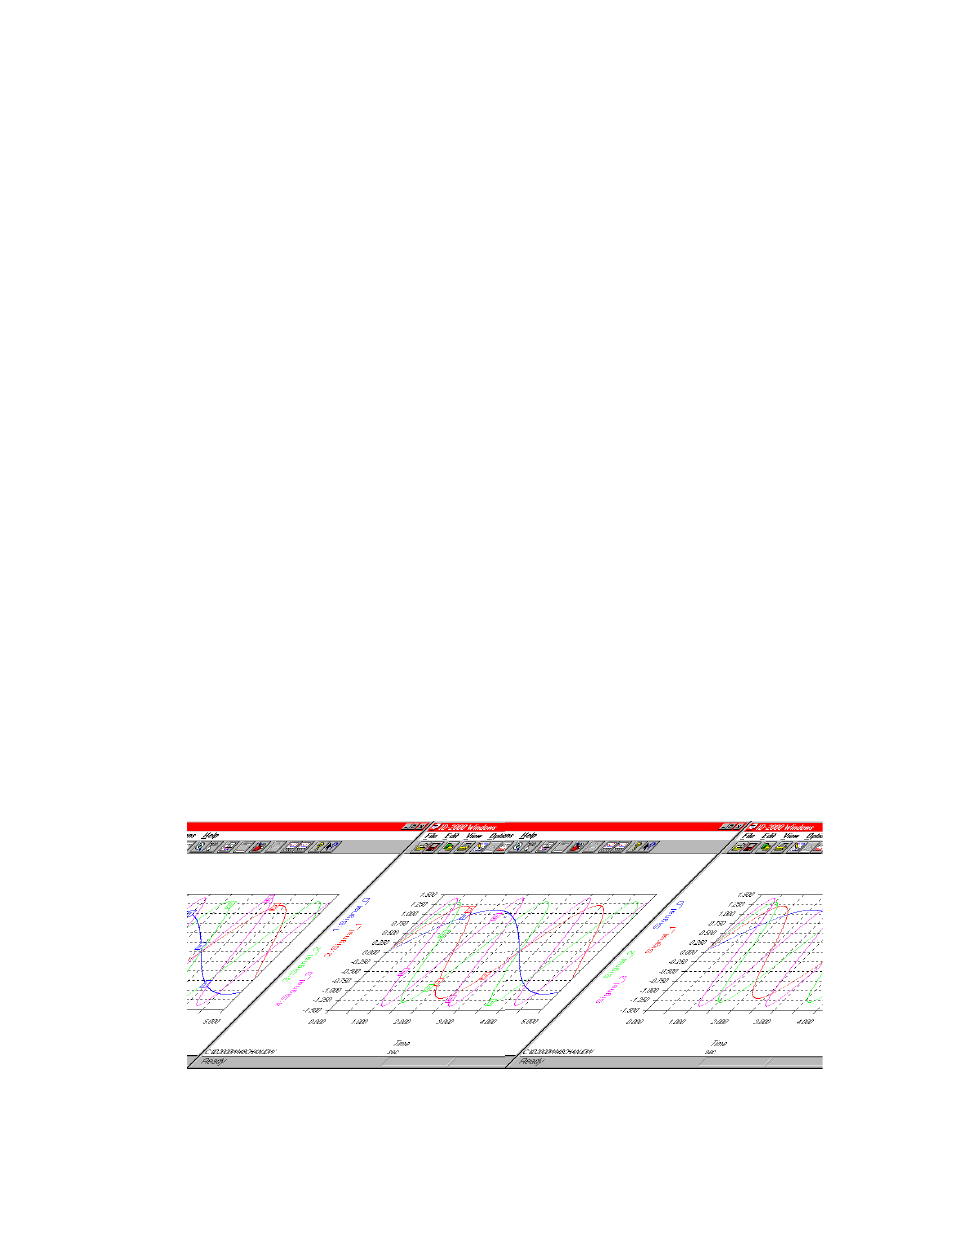
Data Markers:
Data markers are small squares with
numbers inside that are placed directly
over the data on a graph at several
locations to assist you in distinguishing
the data traces. This feature is only
available for the plot types of X-Y-Y
and Multi-Plot. Figure 7-5 illustrates a
plot with and without data markers.
FIGURE 7-5. Data Markers