Campbell Scientific ID-2000W Software User Manual
Page 18
SECTION 1. THE BASICS
1-8
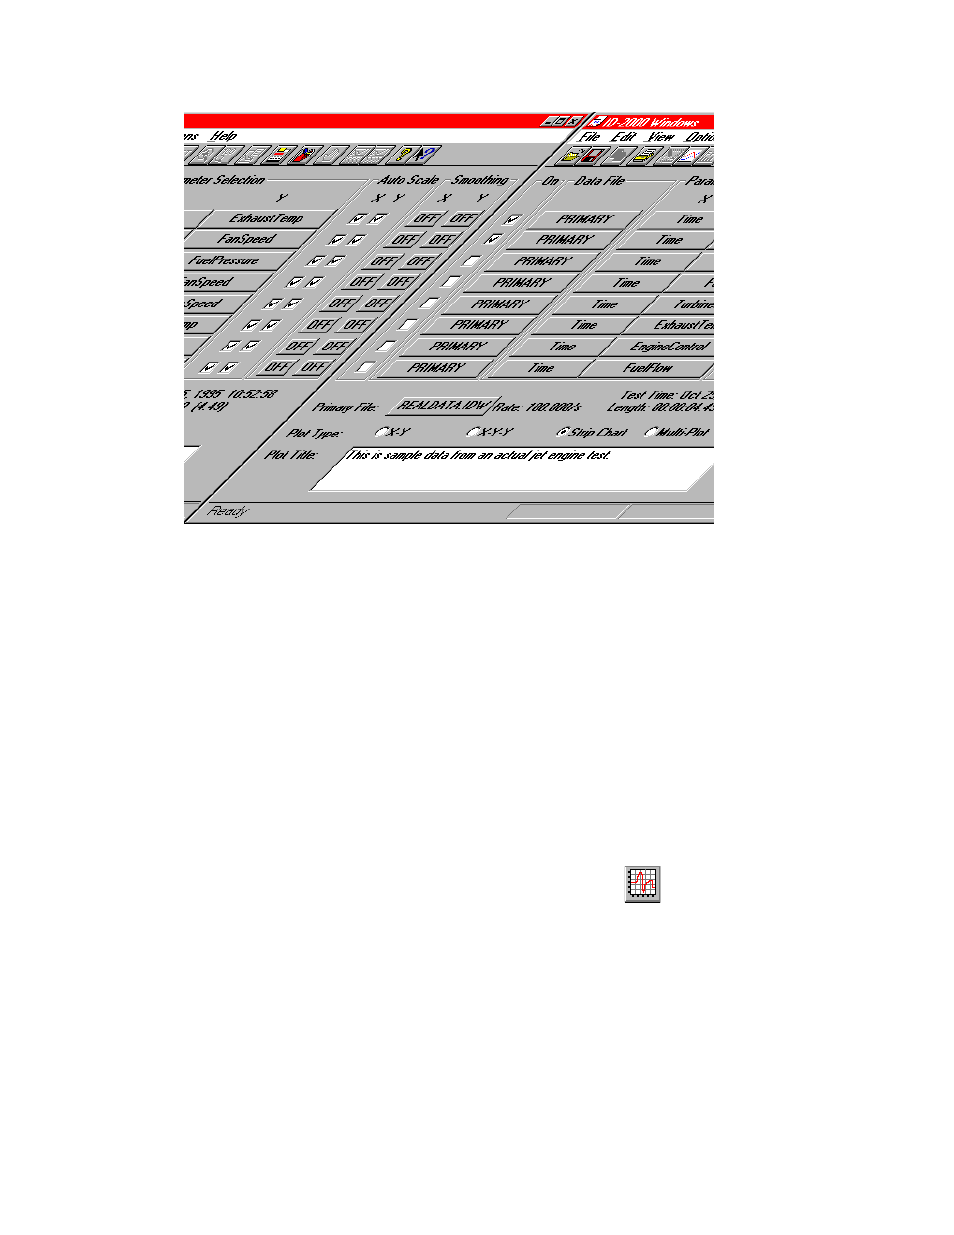
FIGURE 1-7. Plot Template view of ExhaustTemp and FanSpeed vs. Time
OK, now let’s pick our Y-axis parameter -
“ExhaustTemp”. Picking the Y-axis parameter
works just like the X-axis parameter. Click on
the button in the first row under the Y label in
the Parameter Selection group. This causes
the Parameter Selection List dialog box in
Figure 1-6 to re-appear. Now look in the
Parameters list and select the parameter
named “ExhaustTemp”.
That’s all there is to selecting parameters for
plotting! Now let’s do the second strip. Go down
to the second row and “turn on” the second graph
by checking the check box in the “On” column just
like the first row. The X-axis parameter button on
the second row should already be labeled “Time”
so go on over to the Y-axis parameter button.
Click this button to display the Parameter
Selection dialog and select the parameter named
“FanSpeed” in the Parameter List. Verify that the
button label in the Plot Template view has now
changed to FanSpeed.
Look in the group labeled “Auto Scale” and
make sure both boxes are checked for the first
two rows. Now look at the “Smoothing” group
and make sure both buttons are labeled OFF
for the first two rows.
Just one more thing to check. Look down
toward the lower portion of the window to find
the row labeled “Plot Type”. Make sure the
radio button labeled “Strip-Chart” has a dot in it
which means that it is selected. If another plot
type is selected then just click on Strip-Chart to
select it.
The Plot Template should now look like Figure 1-7.
Now we are ready to see what this plot looks
like. Find the toolbar button and click it to
switch to the Plot view. You can also do the
same thing by selecting the View - Switch to
Plot menu item or by pressing the F3 key.
You should see a plot similar to Figure 1-8. The
top strip is a graph of our first parameter,
ExhaustTemp versus Time. The second strip is
FanSpeed versus Time. On Strip-Chart plots
there is only one X-axis which is located at the
very bottom of the plot. All graphs are plotted
against the same X-axis parameter.