Campbell Scientific ID-2000W Software User Manual
Page 21
SECTION 1. THE BASICS
1-11
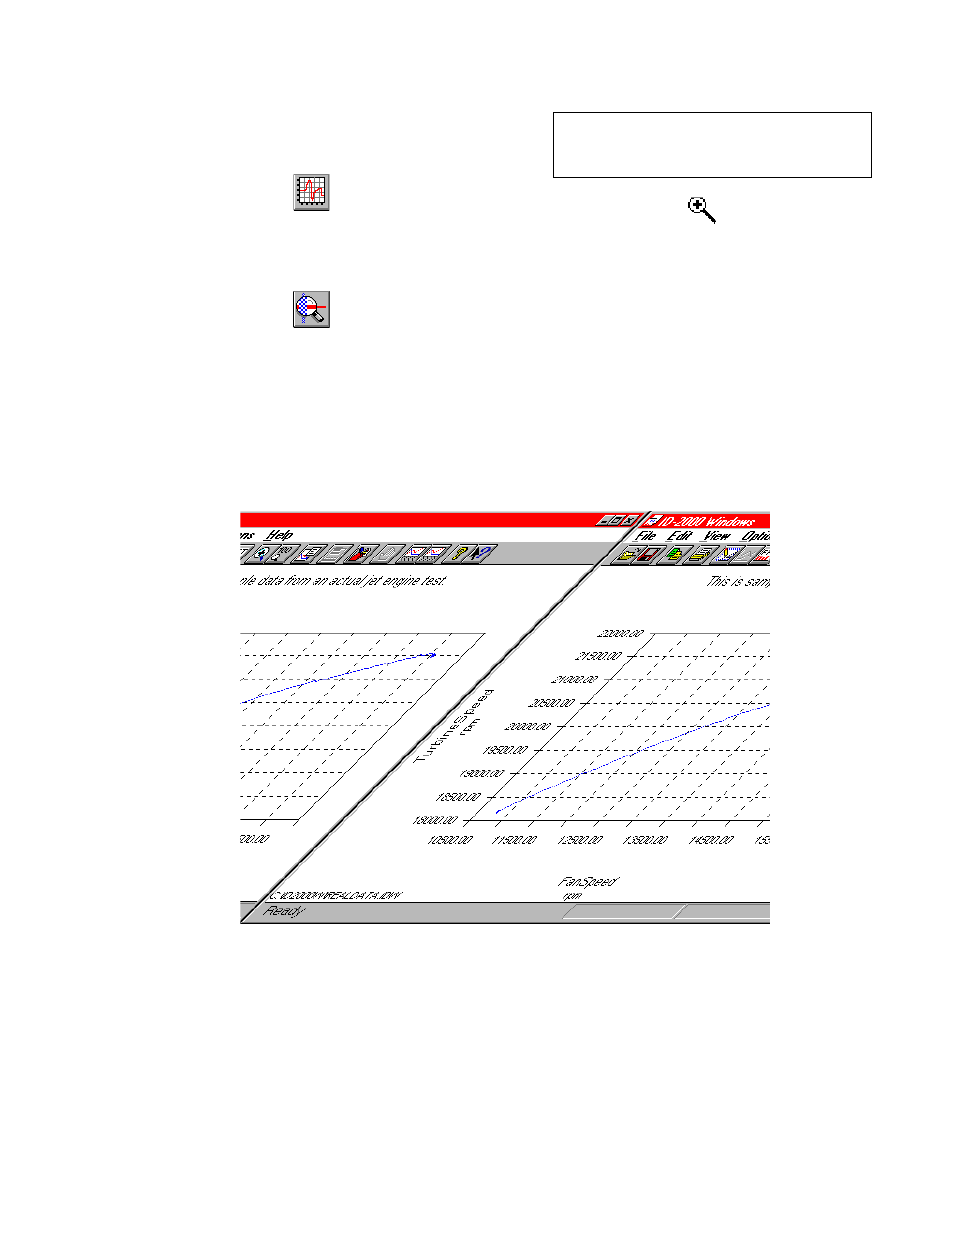
Now you are ready to make your first X-Y plot.
Click on the Plot toolbar button and you should
see the plot displayed in Figure 1-10.
Let’s have a little fun and use the Zoom feature.
We are going to zoom in on the small blob of
data at the top right of the plot.
Click on the Zoom toolbar button to turn on the
zoom feature.
NOTE: When in “zoom” mode the mouse
cursor will change from the standard arrow
to a small magnifying glass.
To zoom in on a plot you draw a rectangle
around the part of the data that you want to
expand. Once you have the magnifying glass
cursor click the mouse where you want one of
the rectangle corners to be and HOLD down the
mouse button. While holding the mouse button
down you are going to be dragging a rubber-
band rectangle along with the mouse cursor.
Move the mouse until the data you want to zoom
in on is inside the rectangle. When the rectangle
is the size you desire then release the mouse
button. The plot will redraw to display only the
data inside the rectangle. See Figure 1-11.
FIGURE 1-10. Plot for FanSpeed versus TurbineSpeed