2 miscellaneous, 3 display items – Campbell Scientific ID-2000W Software User Manual
Page 68
SECTION 7. PREFERENCES
7-4
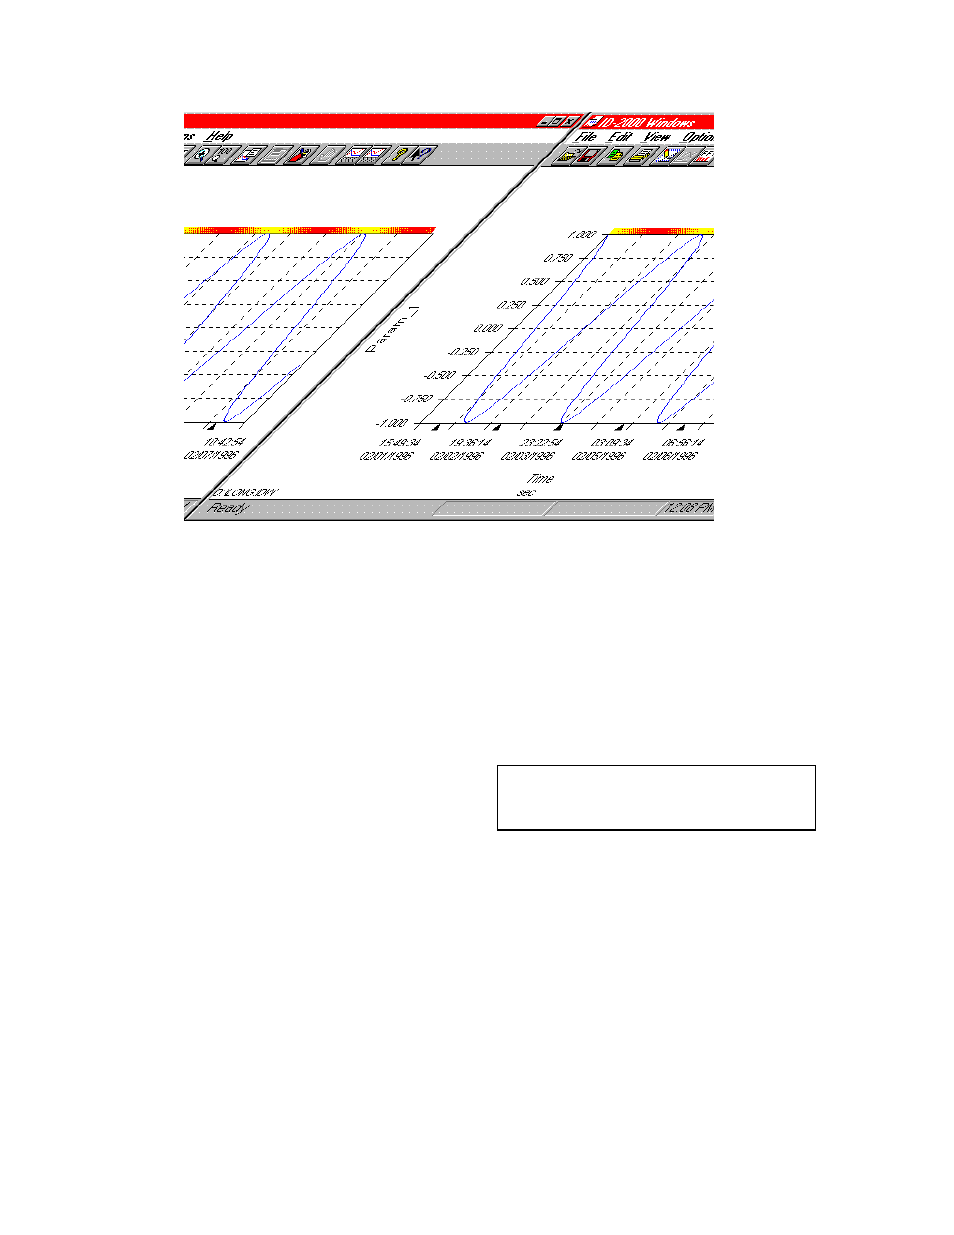
FIGURE 7-4. Time Marker
If you are plotting with the 24hr Clock (Time Of
Day) format then the marks would be 24 hours
apart but the first mark would occur at midnight
following the first data point. In Figure 7-4 the
first point starts at 15:49:34 on February 1. The
first time mark would be located at midnight
February 2 and time marks at each following
midnight.
7.1.2 MISCELLANEOUS
This group contains three items. The first is the
Quick Graph check box. The Quick Graph
feature is useful for plotting very large data files.
With Quick Graph checked, ID-2000 does not
plot every data point. Instead it plots
approximately four data points per pixel of
horizontal screen resolution. If your graph is
400 pixels across then ID-2000 would only plot
1600 data points evenly dispersed throughout
the data file regardless of how many points
were actually in the file. This allows you to
display a representation of a graph quickly. You
may then turn off the Quick Graph feature and
zoom in closer on areas of interest.
Instead of drawing lines between data points
you can tell ID-2000 to just draw the data point.
This type of graph is commonly referred to as a
Scatter graph and is useful when plotting
historical trending data.
The last item in this group is the Data Trace
Width which specifies the line width to use when
plotting data (not used for Scatter graphs). The
default is for the line to be one pixel in width.
You may select or specify any width desired to
make the data traces thicker or thinner.
NOTE: Selecting a width greater than 1
pixel can result in decreased plotting
performance.
7.1.3 DISPLAY ITEMS
This group contains numerous check boxes that
affect how the plot is displayed.
Color Map:
The color map is the multi-colored
stripe at the top of graphs. This feature
is only available for X-Y and Strip Chart
plots with Time, Reference Time, or
Scan_Number selected for the X-axis
parameter. Check this box if you wish
to display the color map. Disabling the
color map can increase plotting
performance in some instances.