3 measurement colors, 1 data tab, 2 chart tab – Campbell Scientific HydroSense II Support Software User Guide User Manual
Page 57: 3 map tab, 3 measurement colors -7, 1 data, Tab -7, 2 chart, 3 map, 3 measurement
Section 5. Settings and Configuration
The window will be updated with the saved settings. Press the Apply button to
update the HydroSense II display with these settings.
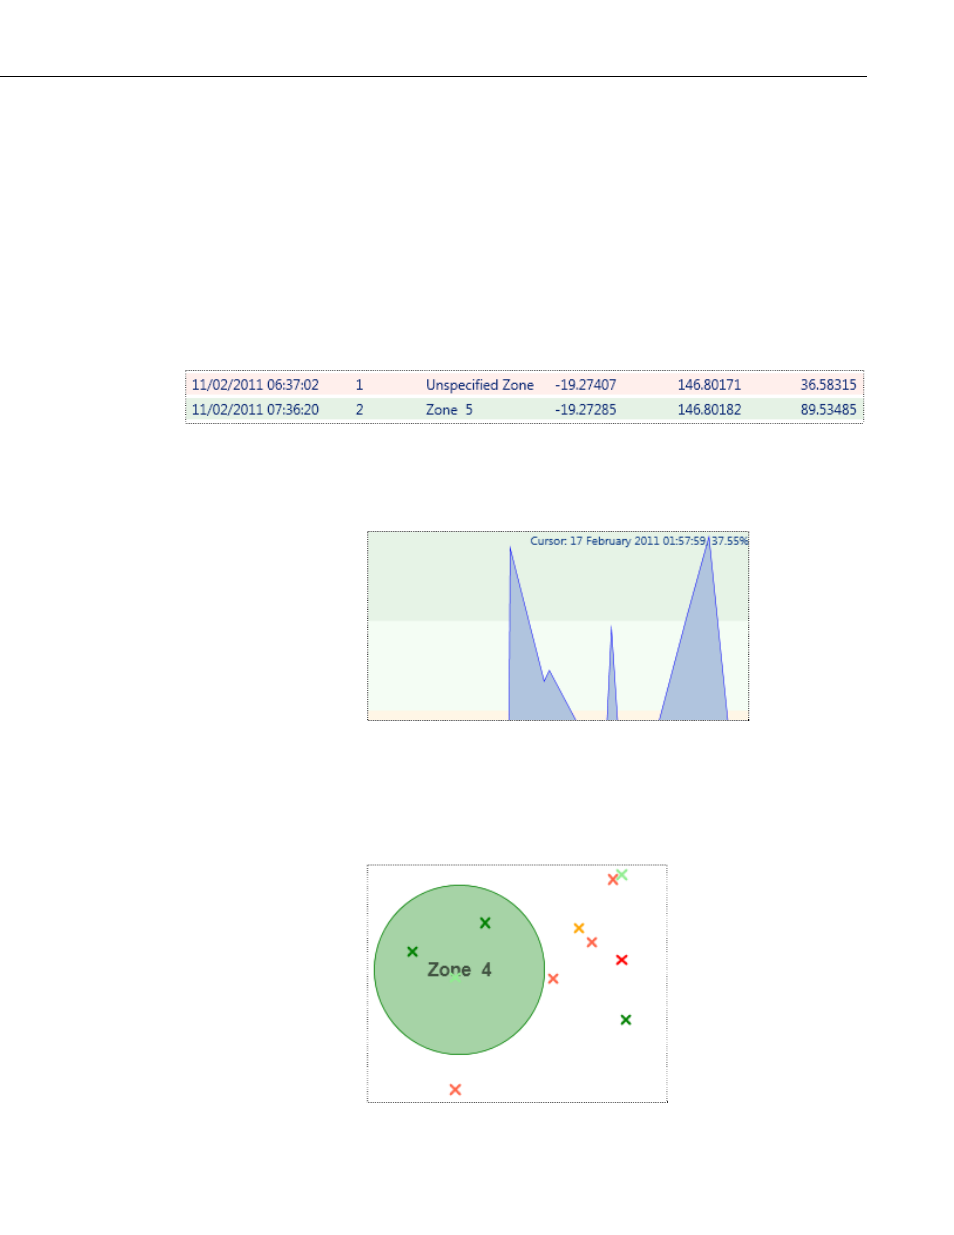
5.3 Measurement Colors
HydroSense II Support Software provides three ways to visualize data: Data
tab, Chart tab and Map tab. In each tab, colors are used to represent the value
of volumetric water content (VWC) from a measurement.
5.3.1 Data Tab
The background of each data record is colored based on the VWC measured at
that point.
5.3.2 Chart Tab
The background of the chart is colored with bands to show colors used for each
level of VWC.
5.3.3 Map Tab
Zones in the map are colored based on the average VWC of all the
measurements located within that zone.
Measurements are colored based on the VWC measured at that point.
5-7
- 014A Met One Wind Speed Sensor (36 pages)
- 020C Wind Direction Sensor (26 pages)
- 024A-L Met One Wind Direction Sensor (30 pages)
- 03001-L R.M. Young Wind Sentry Set (34 pages)
- 03002, 03101, and 03301 R. M. Young Wind Sentry Sensors (40 pages)
- 034A-L WindSet (16 pages)
- 034B-L Met One Windset (34 pages)
- 036, 038 Spark Gapped Junction Box (6 pages)
- 05103, 05103-45, 05106, and 05305 R. M. Young Wind Monitors (30 pages)
- 083E Relative Humidity and Temperature Sensor (22 pages)
- 0871LH1 Freezing Rain Sensor (31 pages)
- 092 Barometric Pressure Sensor (24 pages)
- 10164-L Water Sampler Control Cable for use with Isco and Sigma Autosamplers (18 pages)
- 107-L Temperature Probe (28 pages)
- 108-LC Temperature Probe for MetData1 (12 pages)
- 108-L Temperature Probe (30 pages)
- 109-L Temperature Probe (30 pages)
- 109SS Temperature Probe (32 pages)
- 110PV Surface Temperature Probe (32 pages)
- 21108 RF450 Demo Kit (14 pages)
- 223-L Delmhorst Cylindrical Soil Moisture Block (28 pages)
- 227-L Delmhorst Cylindrical Soil Moisture Block (24 pages)
- 229 Water Matric Potential Sensor and CE4/CE8 (34 pages)
- 237-L Leaf Wetness Sensor (14 pages)
- 247-L Conductivity and Temperature (18 pages)
- 253-L and 257-L (Watermark 200) Soil Matric Potential Sensors (36 pages)
- 25458 DIN-Rail Terminal Kit (10 pages)
- 255-100 Novalynx Analog Output Evaporation Gauge (16 pages)
- 260-953 Alter-Type Wind Screen for Tipping Bucket Rain Gages (14 pages)
- 27106T Gill Propeller Anemometer (18 pages)
- 30066 Battery Terminal Bus (1 page)
- 380, 385, 380M, 385M Met One Rain Gages (22 pages)
- 3WHB10K 3-Wire Half-Bridge Terminal Input Module (14 pages)
- 43347 RTD Temperature Probe and 43502 Aspirated Radiation Shield (40 pages)
- 4386 Battery Terminal Bus (1 page)
- 4WFB120, 4WFB350, 4WFB1K 4-Wire Full Bridge Terminal Input Module (22 pages)
- 4WFBS120, 4WFBS350, 4WFBS1K 4 Wire Full Bridge Terminal Input Modules (46 pages)
- 4WPB100, 4WPB1K PRT Terminal Input Modules (16 pages)
- 52202 Electrically Heated Rain and Snow Gage (16 pages)
- 9522B Iridium Satellite Modem and COM9522B Interface Modem (46 pages)
- A100LK Anemometer (18 pages)
- A150 Desiccated Case (12 pages)
- A21REL-12 Relay Driver (10 pages)
- A6REL-12 Relay Driver (12 pages)
- AL200 ALERT2 Encoder, Modulator, and Sensor Interface (44 pages)