5 map tab, 1 map view sections, 5 map – Campbell Scientific HydroSense II Support Software User Guide User Manual
Page 39: Tab -13, 1 map, View, Sections -13, Map tab, P. 4
Section 4. Viewing Data
4.5 Map Tab
4.5.1 Map View Sections
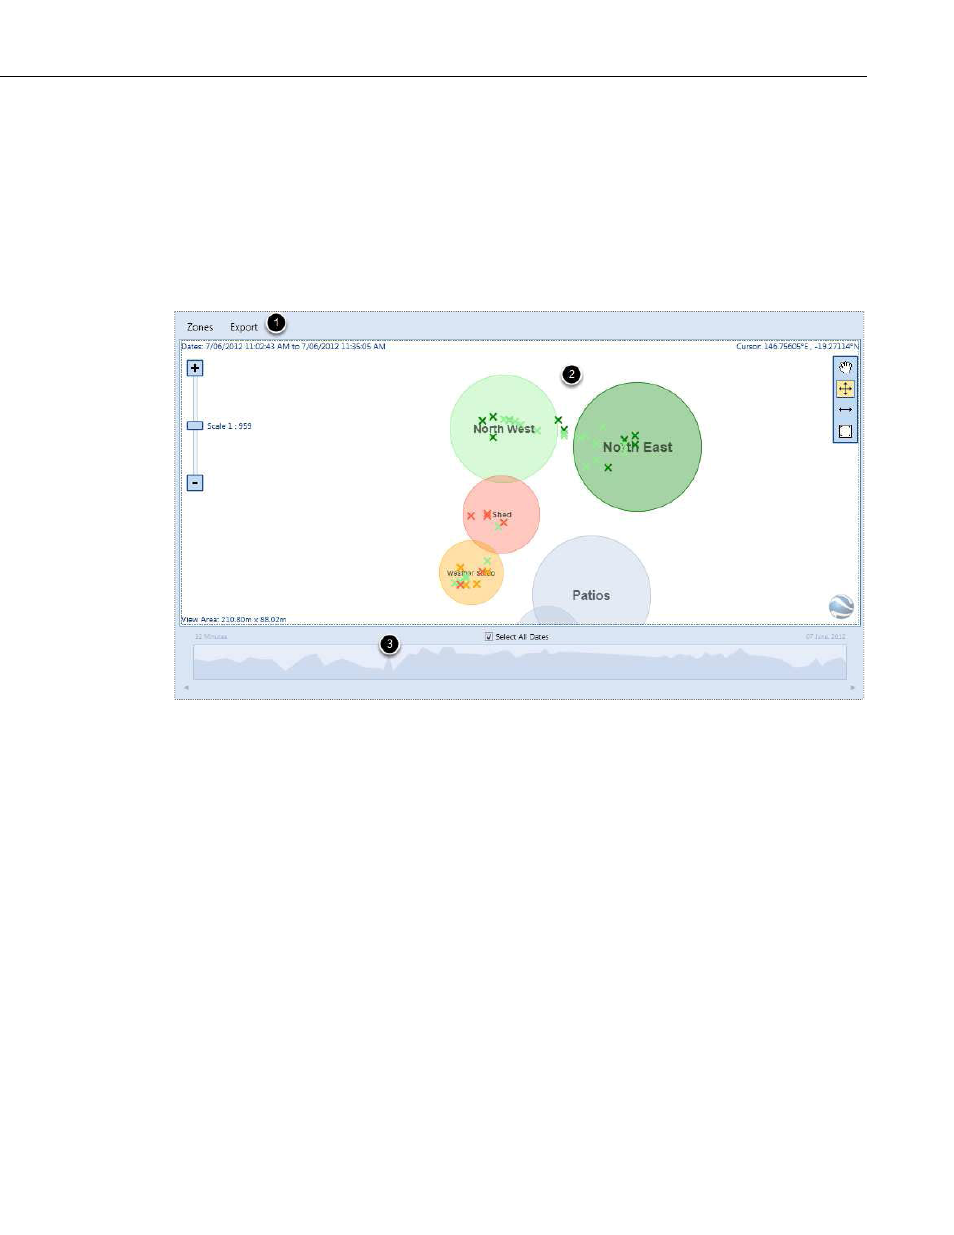
The Map tab plots measurements and zones on a 2D map and colors them
according to aggregate measurement values. The Map tab does not provide the
option to import a background image on which to plot, but it can export the
current map view to Google Earth for viewing against satellite imagery. The
Map tab has three areas.
1. Menu Bar
The Zones menu lists all zones plotted in the main map and allows the user to
zoom to a particular zone by double-clicking on its entry in the list. See
SECTION 4.5.3 Zones List
(4-17) for more information.
The Export menu allows the user to export the current view to either KML
format to import into Google Earth, or GPX format, which supports many
mapping applications. See
SECTION 4.5.4 Export Menu
information.
2. Map
The date range of the points displayed is shown at the upper-left of the main
map. This is the date range which has been chosen with the timeline.
The size of the current viewing area, in meters, is displayed at the bottom left-
hand side of the map. The size of the map can be changed by zooming in and
out or by resizing the main window. The area is expressed as width by height.
4-13