3 map viewing tab, 3 map, Viewing – Campbell Scientific HydroSense II Support Software User Guide User Manual
Page 17: Tab -5
Section 2. Quickstart
By default, the chart displays all measurements. To view a chart for a specific
date range, clear the Select All Dates checkbox and use the timeline (timeline
is below the chart) to highlight a range of dates to display.
For more information on using the Chart tab and the timeline, see
SECTION
(p. 4-10).
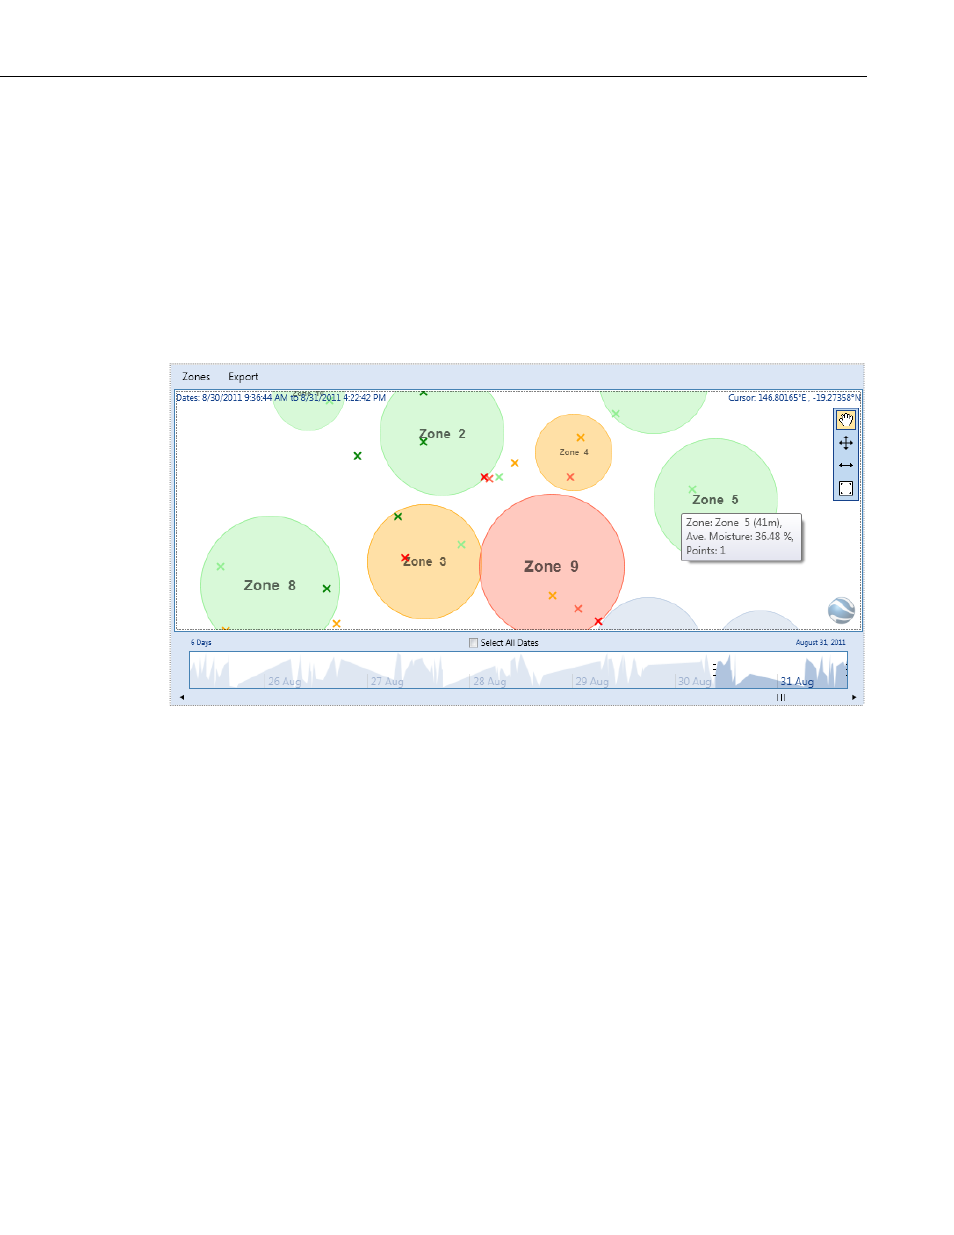
2.5.3 Map Viewing Tab
The Map tab displays measurements and zones on a two-dimensional plot.
Average moisture is calculated for each zone from the measurements within the
zone; the zone is colored accordingly. Moving the pointer over any point or
zone displays an infotip with more detailed information.
By default, all measured points are displayed in the map. The timeline
(timeline is below the map) is used to filter the displayed points by a given date
range.
The toolbox at the right of the window can be used to move and resize zones.
Double-click on a zone to set the zone radius or change the zone name.
For more information on using the Map tab, see
SECTION 4.5 Map Tab
13). For more information on moving and resizing zones, see
SECTION
4.5.6.1 Zone Editing Tools
(p. 4-22).
2-5