2 creating a new zone, 2 creating a new zone -15 – Campbell Scientific HydroSense II Support Software User Guide User Manual
Page 41
Section 4. Viewing Data
Points
Measurements are shown on the map as small cross marks. These cross marks
are not drawn to scale and do not change size during zooming. Each cross is
colored according to the VWC for the measurement. The colors used to
represent different levels of VWC can be changed as described in
SECTION
5.3.4 Changing Measurement Colors
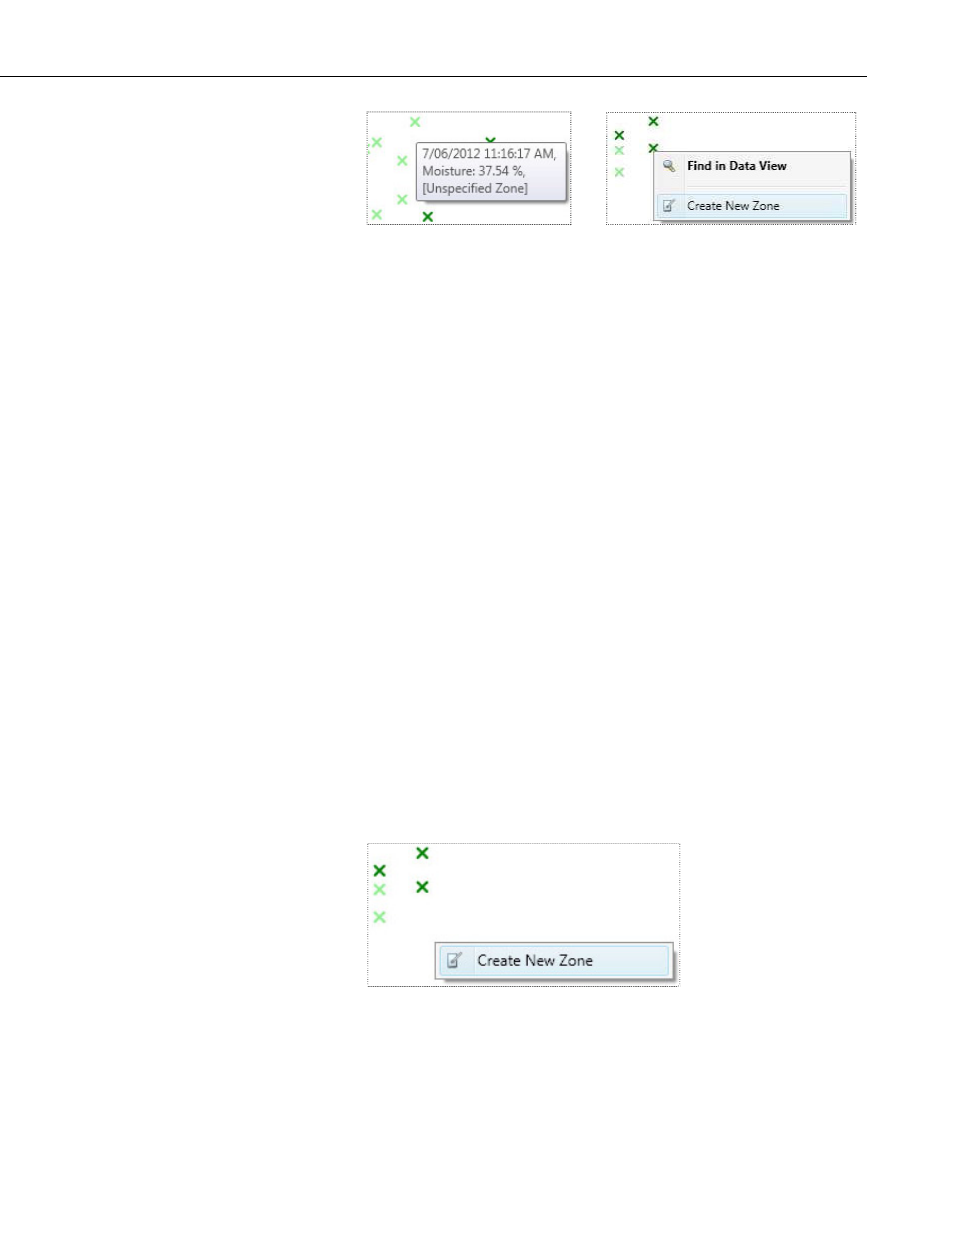
Pausing the pointer over a cross mark will produce an infotip listing the
timestamp, VWC and zones containing the measurement.
Right clicking on the zone shows the zone context menu, with the following
options:
• The Find in Data View menu option will display the Data View and select
the appropriate row for this measurement. This is the default action for a
point and double clicking on the point will perform the same function.
• The Create New Zone menu option will create a new zone centered on the
selected point (see
SECTION 4.5.2 Creating a New Zone
(p. 4-15)).
3. Timeline
The timeline allows the user to filter the measurements shown in the map based
on when measurements were taken. By default, the Select All Dates checkbox
is selected, and all measurements are displayed. For more information on how
to use the timeline, see
SECTION 4.1 Using the Timeline
(p. 4-1).
4.5.2 Creating a New Zone
New zones can be created from the Map View by right clicking on an empty
area on the map or on an existing point, then choosing Create New Zone.
4-15