4 chart tab, 1 chart tab sections, 4 chart – Campbell Scientific HydroSense II Support Software User Guide User Manual
Page 36: Tab -10, 1 chart, Sections -10, P. 4-10
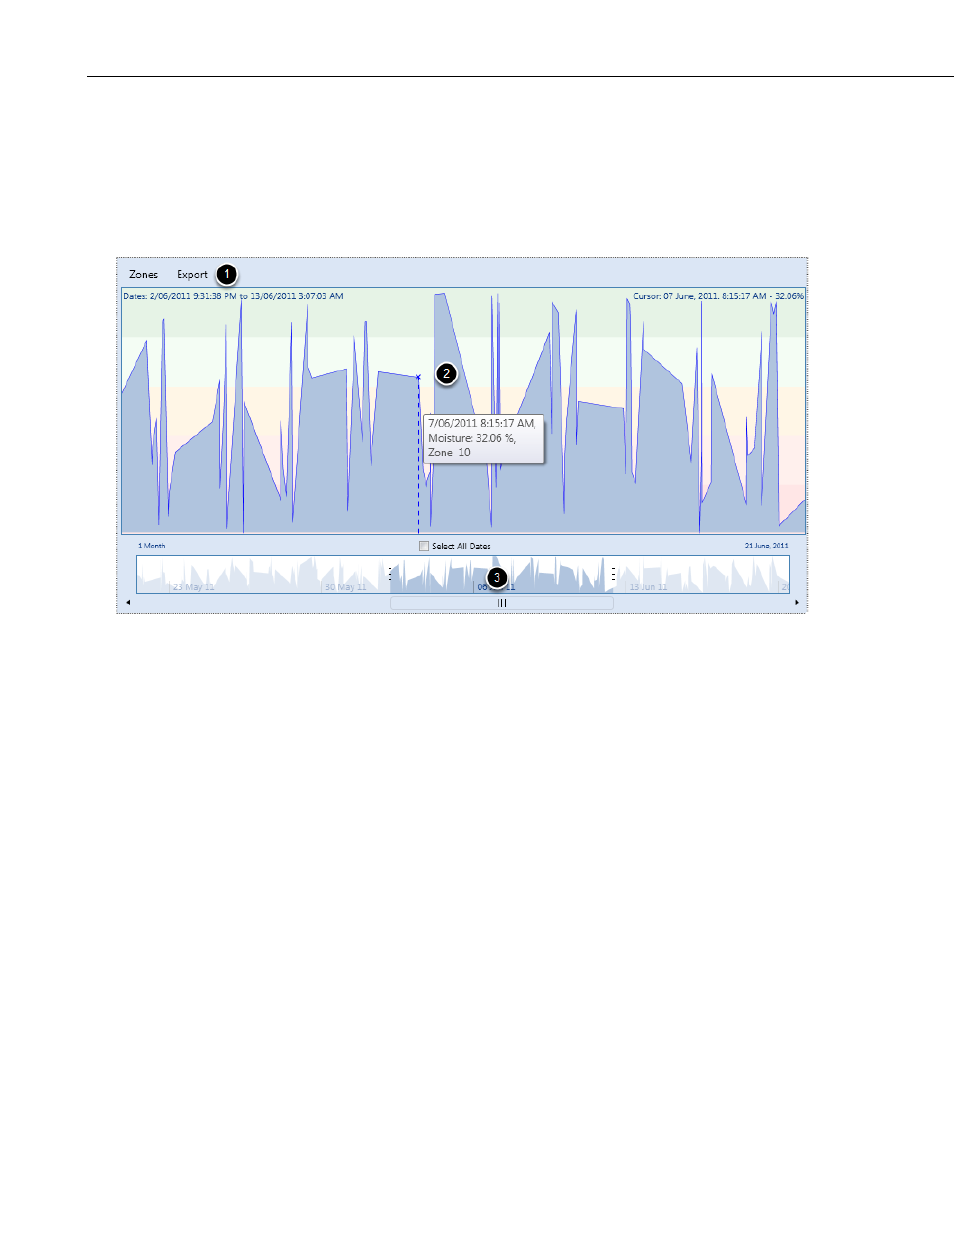
Section 4. Viewing Data
4.4 Chart Tab
4.4.1 Chart Tab Sections
The Chart tab plots volumetric water content (VWC) from each measurement
against time. The tab has three sections.
1. Menu Bar
The menu bar has a Zones menu and an Export menu. The Zones menu allows
the user to display or hide measurements by zone. See
SECTION 4.2 Showing
(p. 4-4) for more information.
The Export menu allows the user to output a .csv file containing the
measurements currently in view. See
SECTION 4.3.3 Export Menu
(p. 4-9) for
more information.
2. Chart
The chart plots volumetric water content as a function of time. The plot can be
scrolled using the timeline, and the measurements included in the plot can be
filtered using the Zone menu. The chart plots volumetric water content as a
function of time. The plot can be scrolled using the timeline, and the
measurements included in the plot can be filtered using the Zone menu.
Moving the pointer over the chart displays a vertical line that will follow the
pointer to indicate the volumetric water content at the pointer position. The
text at the upper-right of the plot shows time of the point over which the
pointer is currently paused, with the associated interpolated water content.
Interpolated water content is the water content expected given the
measurements directly before and after the pointer position. The text at upper-
left of the plot shows the range of dates currently shown in the plot. If the
pointer moves close to a measurement, the pointer changes to dark blue and an
4-10