2 graphic display of flights in map format, Graphic display of flights in map format, Operation manual flytec 6040 gps – Flytec 6040 * User Manual
Page 43
Operation Manual FLYTEC 6040 GPS
41
Caution: make sure before take-off that the GPS-Receiver indicates to receive at least
4 Satellites in order to achieve valid recordings.
Comment 1: in the Flight Analysis are displayed max. values which occured during the flight.
Due to the fact that the display screen is updated every second, these 1-second values are saved
for the flight analysis. If one undertakes a download of such a flight afterwards on the PC using
a program such as Flychart, SeeYou, CompeGPS, MaxPunkte etc., these programs are only
appropriate to evaluate the flight records in IGC format. In the IGC file are saved the time (UTC),
position, barometric altitude, GPS-altitude and True Air Speed of the wind vane or pitot pressure
sensor. The programs now calculate the Variometer values from the altitude data. If for instance, one
has set a recording interval of 10s, and has covered a height difference of 5m during these
10 seconds, there will be calculated a Vario value of 0.5 m/s. However, during this time a 1-second
Vario value of 2m/s may have been performed. It is only this value which shall be indicated on the
Flight-Analysis page and it is not subject to electronic readout. On the flight analysis page both
values are displayed.
Comment 2: although the instrument is capable to store up to 100 flights, we recommend to save the
flights in regular intervals from the instrument to a PC and to reformat the flight memory afterwards
under Main Setup Menu
⇒
Memory
⇒
Delete all Flights.
This procedure ensures the safe data storage
of your precious flights and that the instrument may perform new recordings again with a „refreshed“
flight memory.
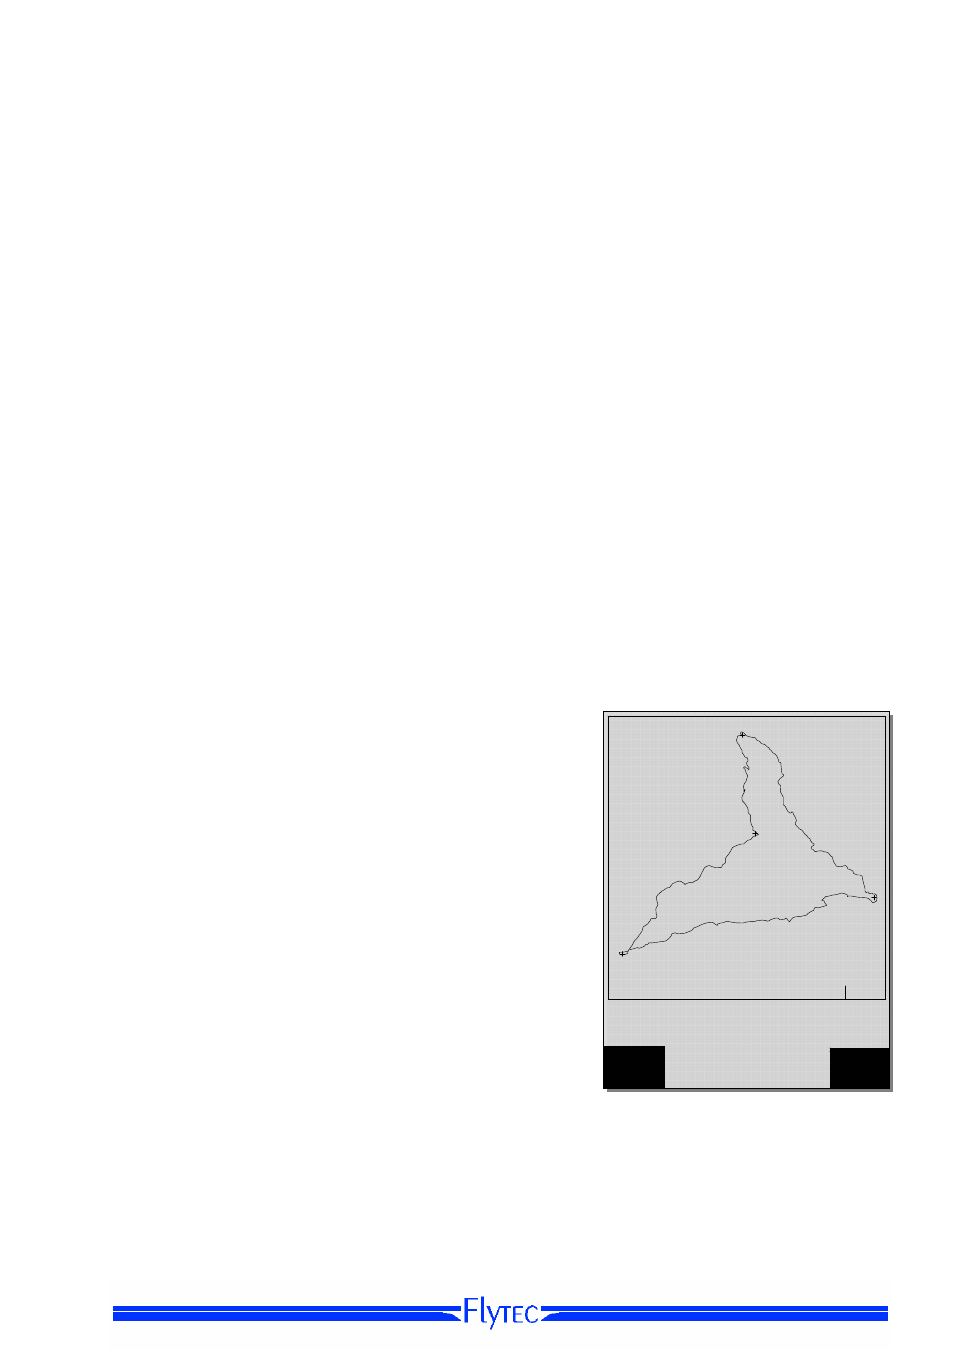
5.1.2 Graphic
display
of
Flights in Map format
The flight route of saved flights can also be shown on the Display screen for appraisal. Within
the item Flight Analysis the F1 key is taken for the function Show Map. After pressing this key
the screen-optimised illustration of the flight route is shown (North is at the top!).
In addition, stored Waypoints are presented with a cross and the name, as well as the map
scale as a short line with km indication. Now the illustration can be altered as follows:
F2: Zoom in: the map scale is gradually increased
up to approx. 0,4 km. Thus individual circles are clearly
recognisable (dependent on the recording interval which was
set).
F1: Zoom out:
the map scale is gradually decreased,
up to the screen-optimised illustration. Maximum is 47.4km
Arrow keys Pan:
by use of these keys the
illustrated area can be shifted up, down, left or right.
OK:
from each graph back again to the screen-
optimised illustration.
ESC:
Return to the Main Setup Menu
All the other keys cause the Track in the current selection to
be redrawn.
Remark:
as the screen layout will take a few seconds
to appear in accordance to the data volume, the message
Wait
and Ready appears on the status line as user information.
If a zoom or pan key is activated during the screen layout, the
momentary process will be stopped and will resume with the new values.
Thus it is possible to obtain the desired graph rapidly.
Start: 17.11.07 14:31
Flight time: 3:14.45
Zoom
In
Zoom
Out
Ready
Quest
Grant
Griffin
Leesburg
15