Monitoring options window, Monitoring options, Window – HP XP Array Manager Software User Manual
Page 52: Monitoring options win, Figure

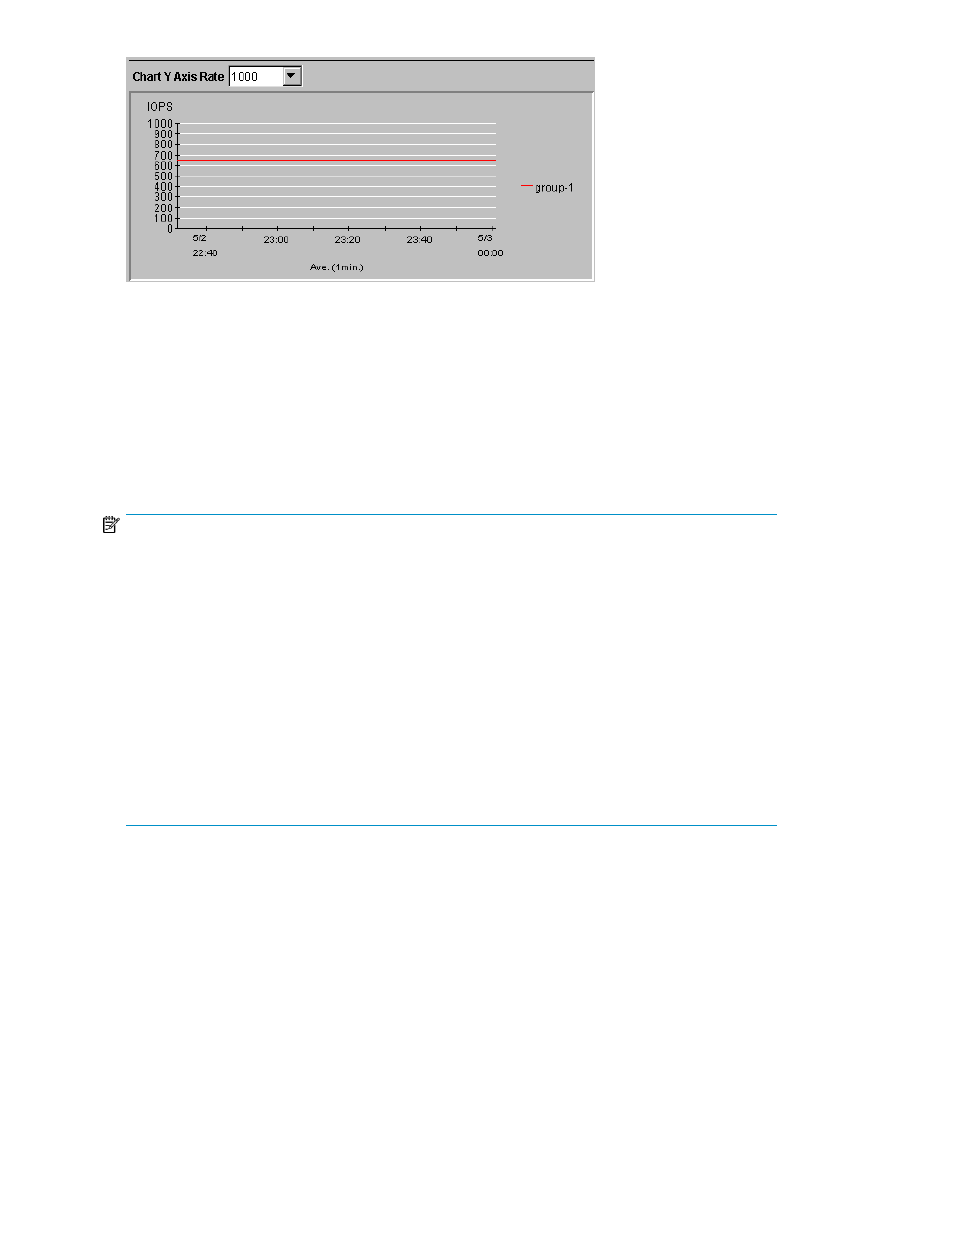
Figure 16 Chart Y Axis Rate List, Detail Check Box, and the List to Select the Item to be Displayed
(Port-LUN tab)
.
Monitoring Options Window
When you click Go, Auto LUN / Perf Ctl / Perf Mon and then Auto LUN on the menu bar of the Remote
Web Console main window, Performance Monitor starts. When you click the Monitoring Options
tab, the Monitoring Options window is displayed. Use it to make settings for obtaining usage rates
about hard disk drives, channel processors, disk processors, and so on.
NOTE:
This note explains the following statistics to be displayed in tabs of the Auto LUN windows.
•
The statistics for LUs that are displayed in the Port-LUN tab.
•
The statistics for volumes that are displayed in the LDEV tab.
In the above tabs, performance statistics for unused volumes are displayed as hyphens (-) if the range
of monitored CUs does not match the range of CUs used in the disk storage system or registered as
external volumes. In addition, depending on your storage system configuration, the list may display
performance statistics for some volumes and not display performance statistics for other volumes.
To correctly display performance statistics, you must specify CUs to be monitored as follows:
•
To display performance statistics for a LUSE volume in the Port-LUN tab, you must specify all
volumes that make up the LUSE volume as the monitoring targets.
•
To display performance statistics for a parity group to be displayed in the LDEV tab, you must
specify all volumes that belong to the parity group as the monitoring target.
Using the Performance Monitor Windows
52
