Port-lun tab of the auto lun window, Figure, Table 4 – HP XP Array Manager Software User Manual
Page 43
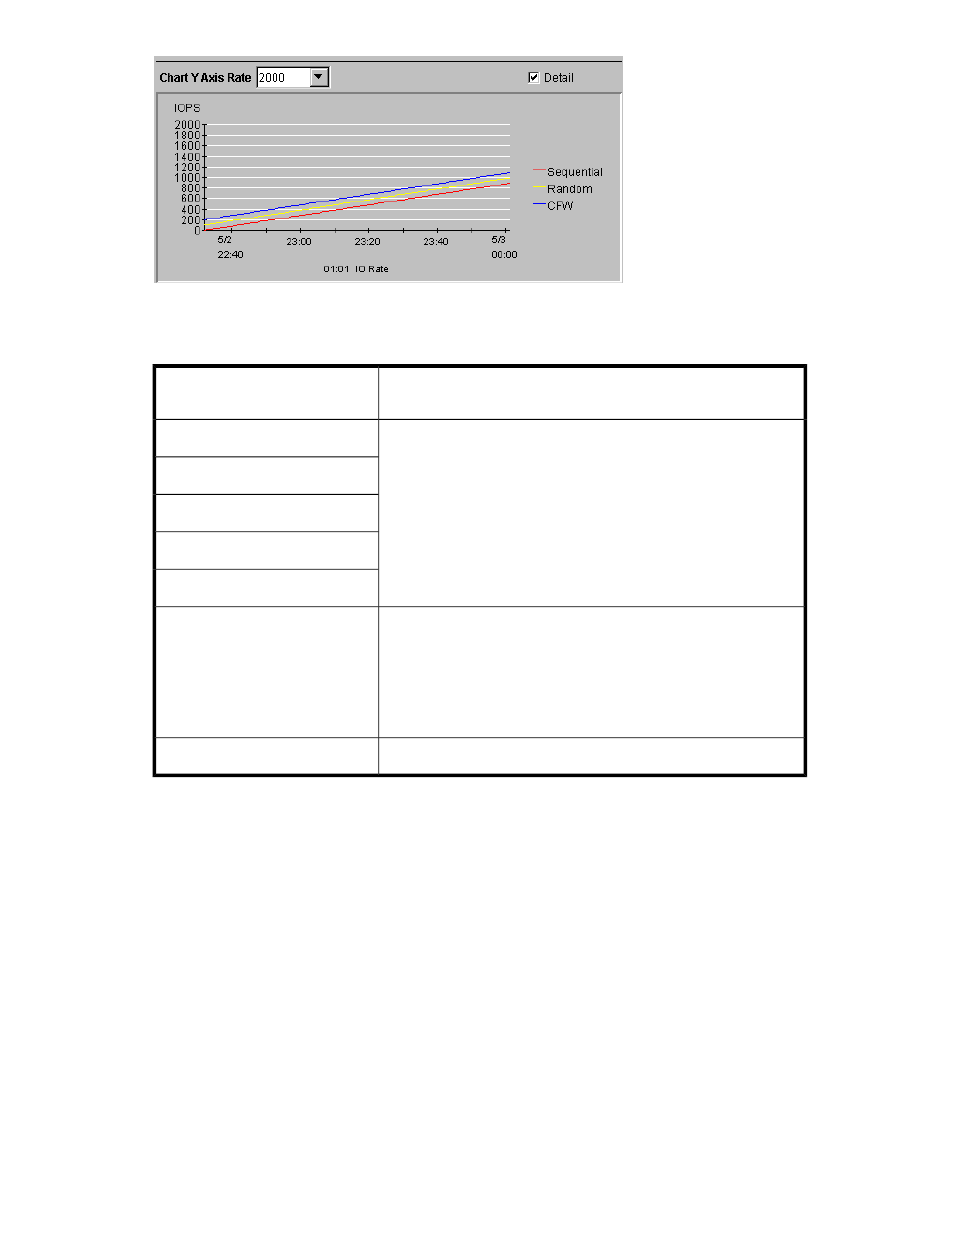
Figure 11 Chart Y Axis Rate List and Detail Check Box (LDEV Tab)
.
Table 4 Detailed Information that can be Displayed in the Graph (LDEV Tab)
The Graph Contains
Select Detail and this Item in the
List
•
Statistics in sequential access mode
•
Statistics in random access mode
•
Statistics in CFW (cache fast write) mode
If the read hit ratio or the write hit ratio is high, random access mode
is used for transferring data instead of sequential access mode. For
example, random access mode is likely to be used for transferring
data to disk areas to which the Cache Residency Manager function
is applied.
IO Rate
Read
Write
Read Hit
Write Hit
•
The number of data transfers from the cache memory to hard disk
drives (Cache to Drive)
•
The number of data transfers from hard disk drives to the cache
memory in sequential access mode (Drive to Cache Sequential)
•
The number of data transfers from hard disk drives to the cache
memory in random access mode (Drive to Cache Random)
Back Trans.
The graph does not display detailed information.
Trans.
Port-LUN Tab of the Auto LUN Window
When you click Go, Auto LUN / Perf Ctl / Perf Mon and then Auto LUN on the menu bar of the Remote
Web Console main window, Performance Monitor starts and the Auto LUN window is active.
The Auto LUN window includes the Port-LUN tab, where you view statistics about I/O rates, transfer
rates , and average response time at storage system ports, host groups, LU paths, etc.
Performance Monitor can obtain statistics about traffics of ports connected to open-system host groups
only. The statistics about traffics of ports connected to mainframe host groups cannot be obtained.
For details on how to use this window, see “
” on page 82 and “
XP24000/XP20000 Performance Monitor User Guide
43