HP XP Array Manager Software User Manual
Page 51
Description
Item
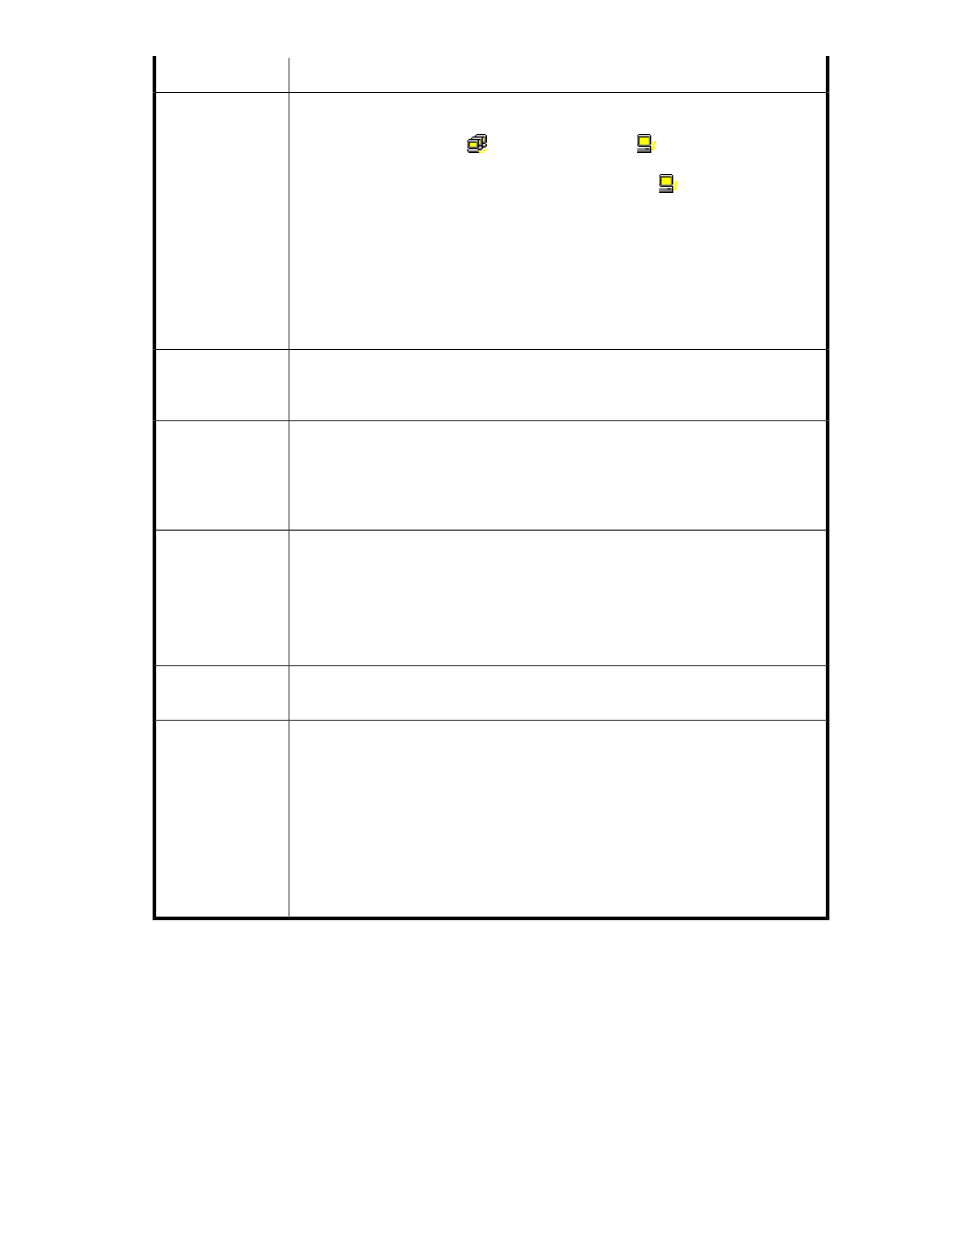
The tree contains the Subsystem folder. Below the Subsystem folder are XP Performance
Control groups, which are groups of multiple WWNs. When you double-click an XP
Performance Control group (
), the host bus adapters (
) belonging to that XP
Performance Control group are displayed. The WWN and the XP Performance Control
name of the host bus adapter are displayed to the right of the
icon. If you double-click
Not Grouped in the tree, host bus adapters (WWNs) that do not belong to any XP
Performance Control group are displayed.
If the WWN of a host bus adapter (HBA) is displayed in red in the tree, the host bus
adapter is connected to two or more ports, but the traffic between the HBA and some
of the ports are not monitored by Performance Monitor. When many-to-many connections
are established between HBAs and ports, make sure that all the traffic between HBAs
and ports is monitored (see the HP StorageWorks XP24000/XP20000 Performance
Control User Guide for instructions).
Tree
Displays statistics (for example, I/O rates, transfer rates, or average response time) for
the item selected in the tree. For details on the list contents, see “
between Host Bus Adapters and Ports
List
Starts the XP Performance Control program product if XP Performance Control is enabled.
For details on XP Performance Control, see the HP StorageWorks XP24000/XP20000
Performance Control User Guide.
The PFC button is deactivated in real-time mode. To start XP Performance Control, activate
the From and To boxes and release Performance Monitor from real-time mode.
PFC
Current system control.
•
Port Control: The system is controlled by the upper limits and the threshold specified
in the Port tab of the Performance Control window.
•
WWN Control: The system is controlled by the upper limits and the threshold specified
in the WWN tab of the Performance Control window.
•
No Control: The system performance is not controlled by XP Performance Control.
Current Control
Displays a line graph that illustrates changes in the I/O rate or the transfer rate. The
graph can display up to eight lines simultaneously.
Draw
An illustration of the changes in the I/O rate or the transfer rate. The vertical axis
indicates the usage rates (in percentage). The horizontal axis indicates dates and/or
times.
When the graph displays I/O rates or the transfer rates for a host bus adapter or an
XP Performance Control group controlled by an upper limit, the graph also displays a
line that indicates the upper limit.
When you draw a graph, use the Detail check box and the list to illustrate the desired
information and use the Chart Y Axis Rate list to arrange the graph convenient to work.
Use the Chart Y Axis Rate list to select the highest value of the Y-axis (the vertical axis)
of the graph.
Line graph (
)
XP24000/XP20000 Performance Monitor User Guide
51