Refreshing information, Components of the array view screen, Cache usage chart – HP XP Performance Advisor Software User Manual
Page 44
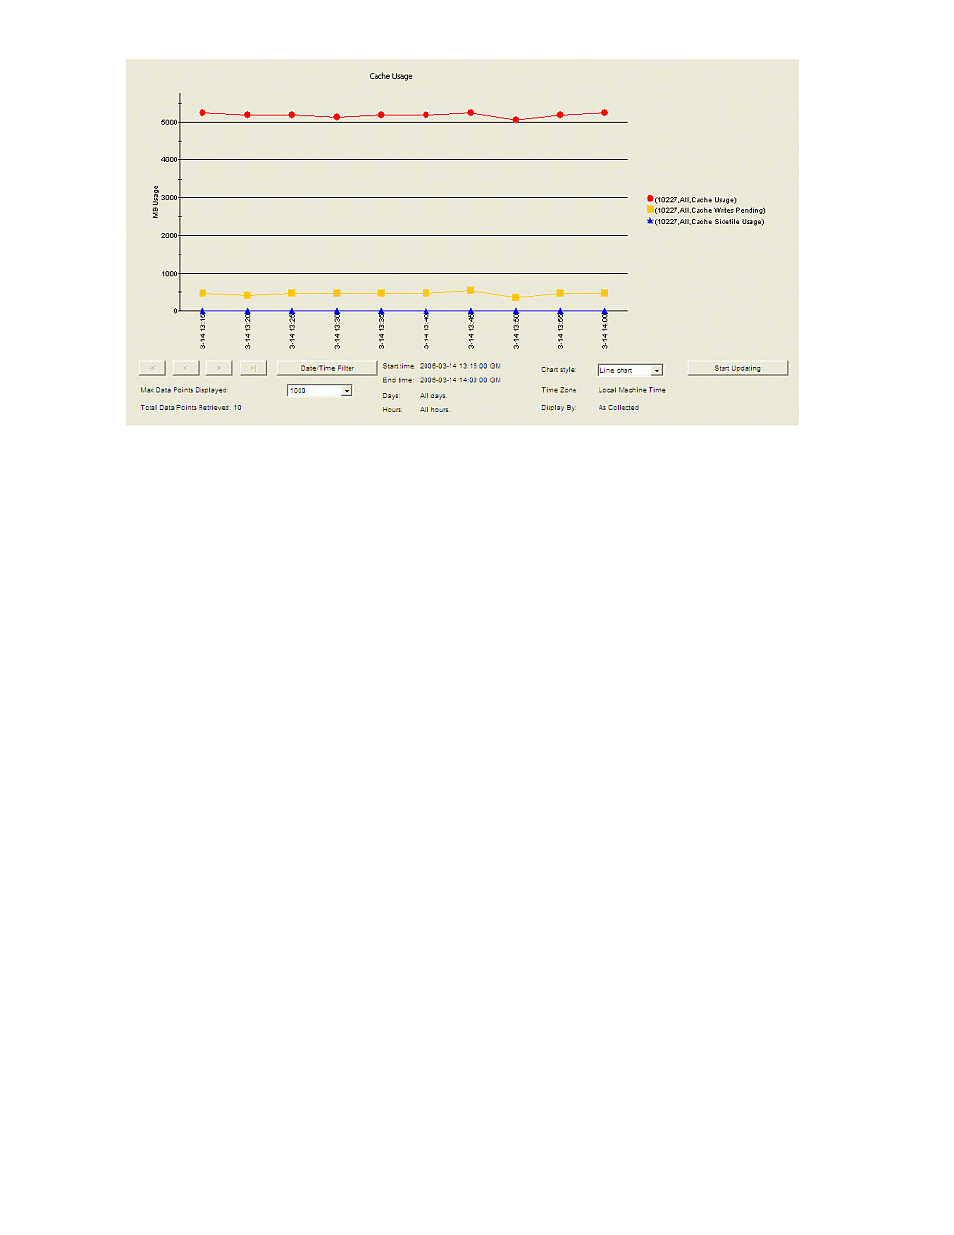
Figure 20 Cache usage chart
The chart displays the cache usage, cache writes pending, and the sidefile usage measured in (MBs
per 5 seconds) for the selected array. You can select the date and time range using Date/Time Filters,
the maximum data points displayed from the drop-down menu and the chart style from the Chart style
drop-down menu.
Refreshing information
Information for the Array View screen is retrieved from the database every 4 minutes and displayed in
the tables.
Components of the Array View screen
lists the components that appear on the Array View screen.
44
Array View
See also other documents in the category HP Storage:
- StorageWorks MSL6000 Tape Library (61 pages)
- Лент-е накопители HP StoreEver DAT (64 pages)
- Лент-е накопители HP StoreEver DAT (50 pages)
- Linear Tape File System Software (25 pages)
- StoreEver Ultrium Tape Drives (78 pages)
- StoreEver Ultrium Tape Drives (76 pages)
- Linear Tape File System Software (20 pages)
- StoreEver Ultrium Tape Drives (61 pages)
- StoreEver TapeAssure Software (40 pages)
- StoreEver Ultrium Tape Drives (75 pages)
- StoreEver Ultrium Tape Drives (60 pages)
- Linear Tape File System Software (28 pages)
- 2600fx Optical Disk Drive (65 pages)
- Ленточный автозагрузчик HP StorageWorks DAT 72x10 (58 pages)
- StorageWorks 1000 Modular Smart Array (72 pages)
- StorageWorks 1000 Modular Smart Array (81 pages)
- StorageWorks 1500cs Modular Smart Array (48 pages)
- StorageWorks 1500cs Modular Smart Array (52 pages)
- StorageWorks 1500cs Modular Smart Array (71 pages)
- 2000fc Modular Smart Array (150 pages)
- Servidor de almacenamiento HP ProLiant DL585 G2 (152 pages)
- Sistemas de almacenamiento de red HP StorageWorks X3000 (152 pages)
- Software de HP StoreVirtual VSA (127 pages)
- Software de HP StoreVirtual VSA (85 pages)
- X500 Data Vault (331 pages)
- StorageWorks 1000i Virtual Library System (122 pages)
- XP Array Manager Software (101 pages)
- StorageWorks XP Remote Web Console Software (20 pages)
- 200 Storage Virtualization System (176 pages)
- StorageWorks MSA 2.8 SAN Switch (22 pages)
- StorageWorks MSA 2.8 SAN Switch (104 pages)
- StorageWorks MSA 2.8 SAN Switch (270 pages)
- StorageWorks MSA 2.8 SAN Switch (307 pages)
- StorageWorks All-in-One SB600c Storage Blade (80 pages)
- StorageWorks All-in-One SB600c Storage Blade (78 pages)
- StorageWorks All-in-One SB600c Storage Blade (60 pages)
- StorageWorks All-in-One SB600c Storage Blade (72 pages)
- ProLiant DL585 G2 Storage-Server (150 pages)
- Data Protector Express Basic-Software (83 pages)
- Data Protector Express Basic-Software (93 pages)
- ProLiant High Availability Storage Server (72 pages)
- ProLiant DL185 G5 Storage Server (174 pages)
- P2000 G3 MSA Array Systems (58 pages)
- StorageWorks 2000fc G2 Modular Smart Array (76 pages)
- 2000I G2-Modular-Smart-Array (48 pages)