Total i/o rate by hour of day report, Total i/o rate detail report, Total i/o rate by hour of day – HP XP Performance Advisor Software User Manual
Page 132
NOTE:
If there are no data points available for the dates selected, a blank chart will be displayed. If all the data
values are zero for the dates selected, a chart with a horizontal line along X axis will be displayed in
the center.
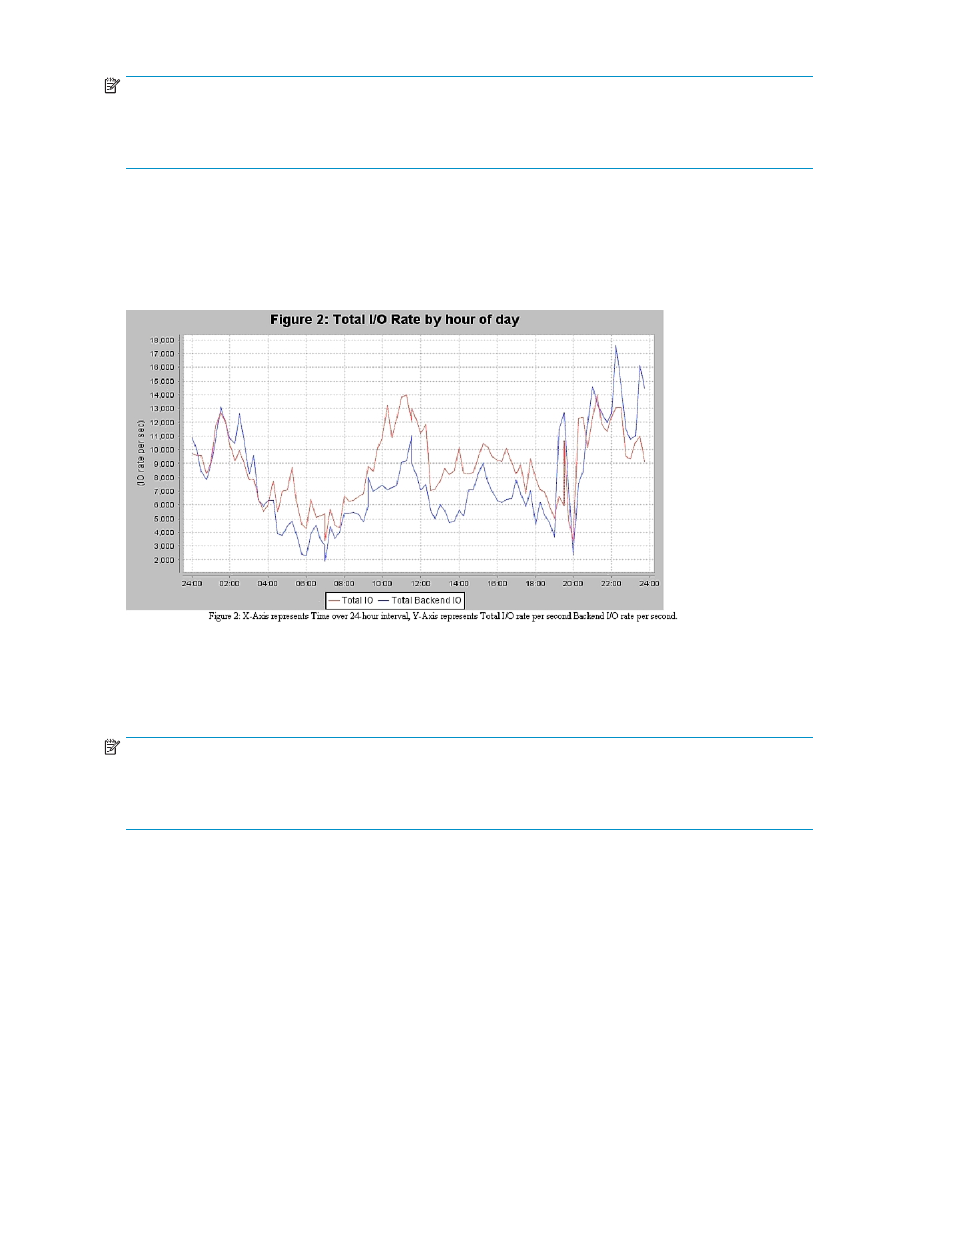
Total I/O Rate by hour of day report
The Total I/O Rate by hour of day report shows in a chart format, the number of total read and write I/O
operations per second over the over 24-hour period.
shows a sample
Total I/O Rate by hour of day report for XP1024..
Figure 58 Total I/O Rate by hour of day
Total Back-end I/O may be compared to Total I/O and the difference is due to the effects of the array
cache. The Back-end I/O load is borne by the Array Groups and ACP pairs, whereas the Total I/O load
is borne by the CHIP ports.
NOTE:
If there are no data points available for the dates selected, blank chart will be displayed. If all the data
values are zero for the dates selected, a chart with a horizontal line along X axis will be displayed in
the center.
Total I/O Rate Detail report
The Total I/O Rate Detail report shows in a chart format, the number of Sequential I/O, Random I/O,
and CFW I/O operations per second, over the entire data collection period.
shows
a sample Total I/O Rate Detail report for XP1024.
132
Appendix