Viewing data, Using the performance history screen, Performance history screen – HP XP Performance Advisor Software User Manual
Page 113
Viewing data
When you click Show Chart in the Charts screen, information is retrieved from the database based on
your specifications and appears in graphical format in the Performance History screen as shown in
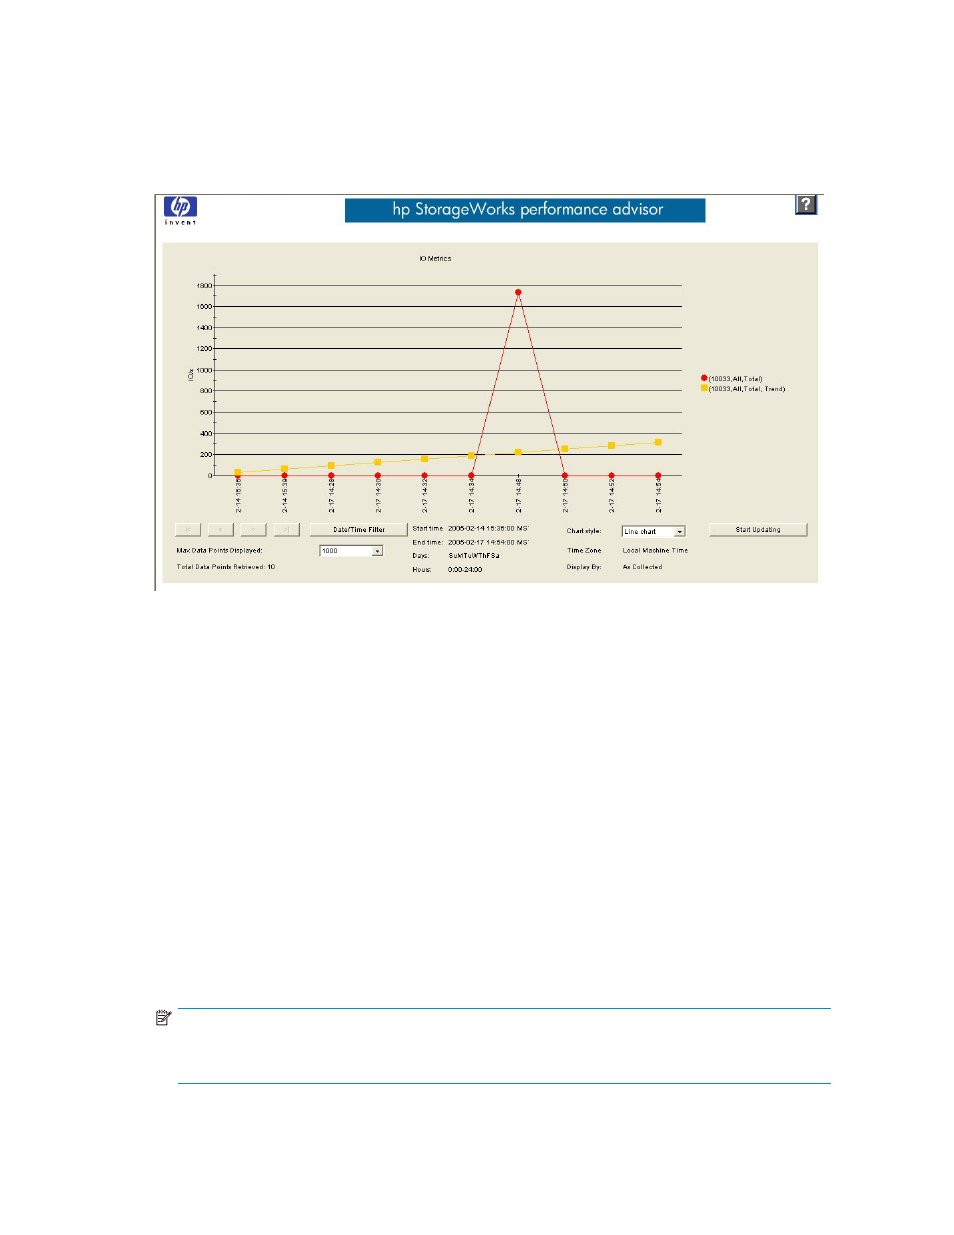
Figure 47 Performance History screen
The Performance History screen shows a graph of 10 sets of data for the metric(s). The graph displays all
available data if fewer than 10 collection periods have occurred. A maximum of 1000 data points are
displayed even if the selected time range contains more than 1000 data points.
The color of each line in the chart is defined in the legend located to the right of the chart. The metric(s)
displayed vary depending on your selection in the Charts screen.
Using the Performance History screen
The following buttons below the graph extend your viewing options:
•
Back/Forward: Use these four buttons to display data points that are not currently displayed
on the chart. These buttons become available when the total data points retrieved exceed the
maximum data points displayed setting.
•
Date/Time Filter: Click this button to open a calendar and select the start and end times for the
data that you want displayed. A maximum of 1,000 records can be returned even if more data is
available. Use this screen to enter the date and time to display the desired data. Click OK to set
the start and end times, or click Cancel to delete any changes.
•
Start Updating: Click this button, and the system regularly checks the database for new data. If
new data is found, the newest data point is added to the right side of the graph. All other data
points are shifted one column to the left, and the far left column is removed.
NOTE:
If the chart contains metrics from different arrays, Start Updating is disabled. It is also disabled
for aggregate items.
HP StorageWorks Performance Advisor XP Software user guide
113