Using the summary by drop-down menu, Port data dialog box, Grid display screen drop-down menus – HP XP Performance Advisor Software User Manual
Page 24
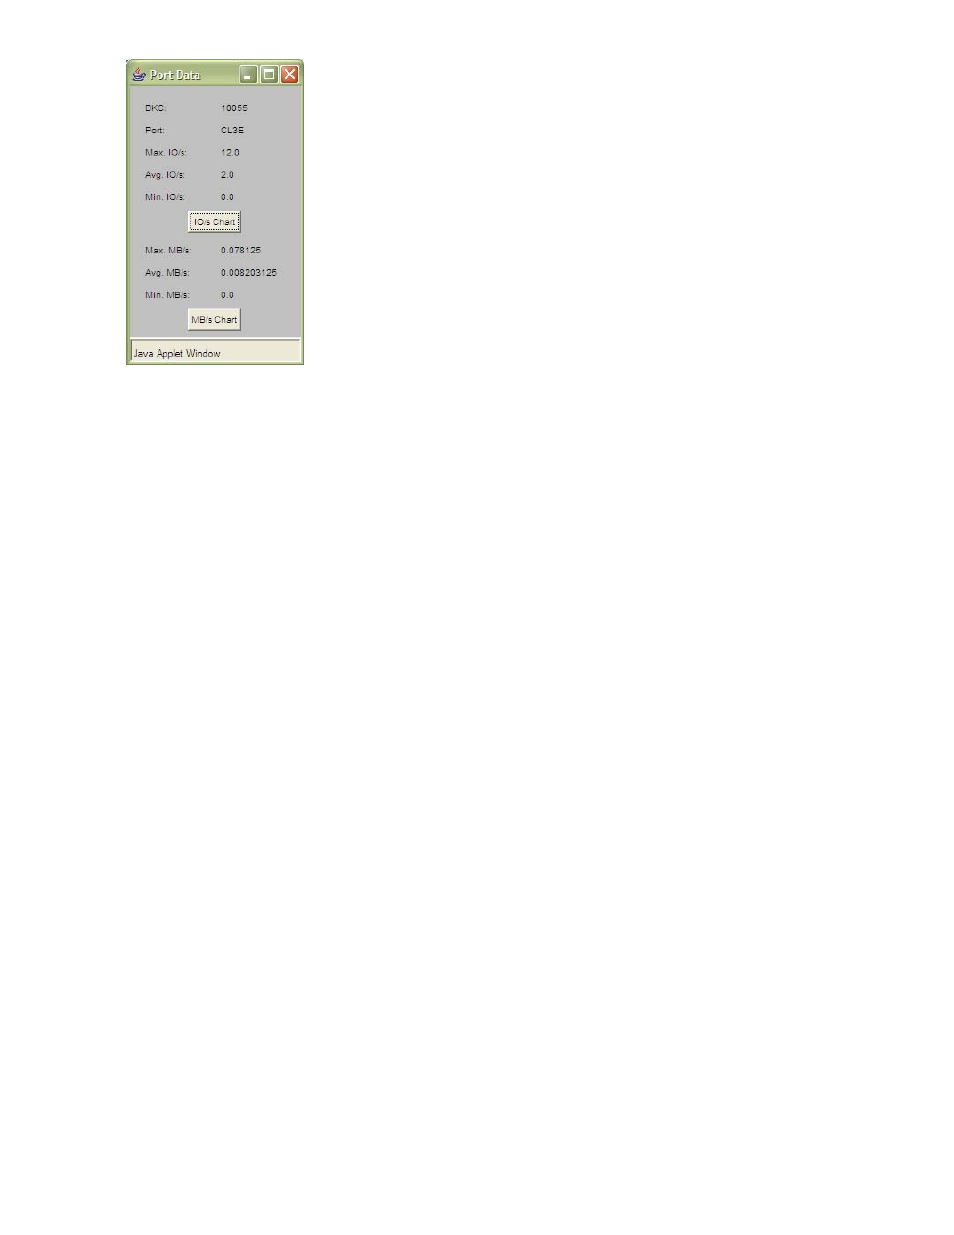
Figure 5 Port Data dialog box
Click IO/s Chart or MB/s Chart to display the Performance History screen. You can view the data in any
of the following Chart Style from the drop-down menu:
•
bar chart
•
line chart
•
stackable chart
Table 3 Grid Display screen drop-down menus
Drop-down Menu
Description
Show Array
Shows a specific array or all arrays.
Show Host
Shows a specific host or requested hosts.
Show RAID Group
Enter the physical location of the drive.
Show Host Group
Shows a specific host group or all host groups.
Show CHP Port
Shows a specific CHP Port or all ports.
Show ACP Pair
Shows a specific ACP pair or all ACP pairs.
Show Volume Group
Shows a specific volume group or all volume groups.
Show LUSE
Shows a specific LUSE or all LUSEs.
Show SLPR Group
Shows a specific SLPR group or all groups.
Show CLPR Group
Shows a specific CLPR group or all groups.
Show Journal Group
Shows a specific Journal Group or all groups.
Display Type
Shows the display type, whether mainframe, open systems, or
both. This feature is enabled only when the data that you are
collecting is a mixture of mainframe and open systems.
Summary by
Provides an overall summary of each RAID group or port on a
given array. See the section below for more information about
this menu option.
Using the Summary by drop-down menu
You can use the Summary by drop-down menu to view a summary of each RAID group or port on a
given array. This feature totals the LDEV I/Os, LDEV MBs, cache fast write, disk fast write, cache bypass,
24
Grid Display