Chart calendar screen – HP XP Performance Advisor Software User Manual
Page 104
3.
Use the Metric drop-down menu to refine information for a metric. For example, to view the total
input-output operations on LDEV performance, select LDEV Total IO.
4.
If you select any item in the Metric drop-down box, pertaining to volumes, the CU drop-down menu
displays. The CU drop-down menu lists LDEVs by CU. Selecting a CU displays the list of LDEVs,
belonging to that CU, in the Resources list box.
5.
The title and information in the field to the right of the drop-down menus reflect the Metric Category
selections. For example, if you select IO Metrics in the Metric Category drop-down menu, the title for
the field shows LDEV and lists the available LDEVs. You can further refine the metric information to
be charted, by selecting specific items.
6.
Click to highlight the components that you want to chart. To add more than one item, hold down the
Shift or Ctrl key while making your selections.
NOTE:
You can select a maximum of eight components to chart.
7.
Click Add to add the components to the Selected Metrics field. Click Add Trend to show the rate
of change of the specified metrics.
8.
To remove an item from the Selected Metrics field, click to highlight the item, and click Remove.
9.
Repeat steps 2 through 6 to add all the items that you want to chart. Use any combination of arrays
and metrics provided you select from the same metric category and select eight or fewer items.
10.
Click Set Range to filter the data by time at the start of the query. You can also select this option in
the Performance History screen after receiving the data. If you do not select a specific time range,
the 10 most recent data points are displayed in the chart.
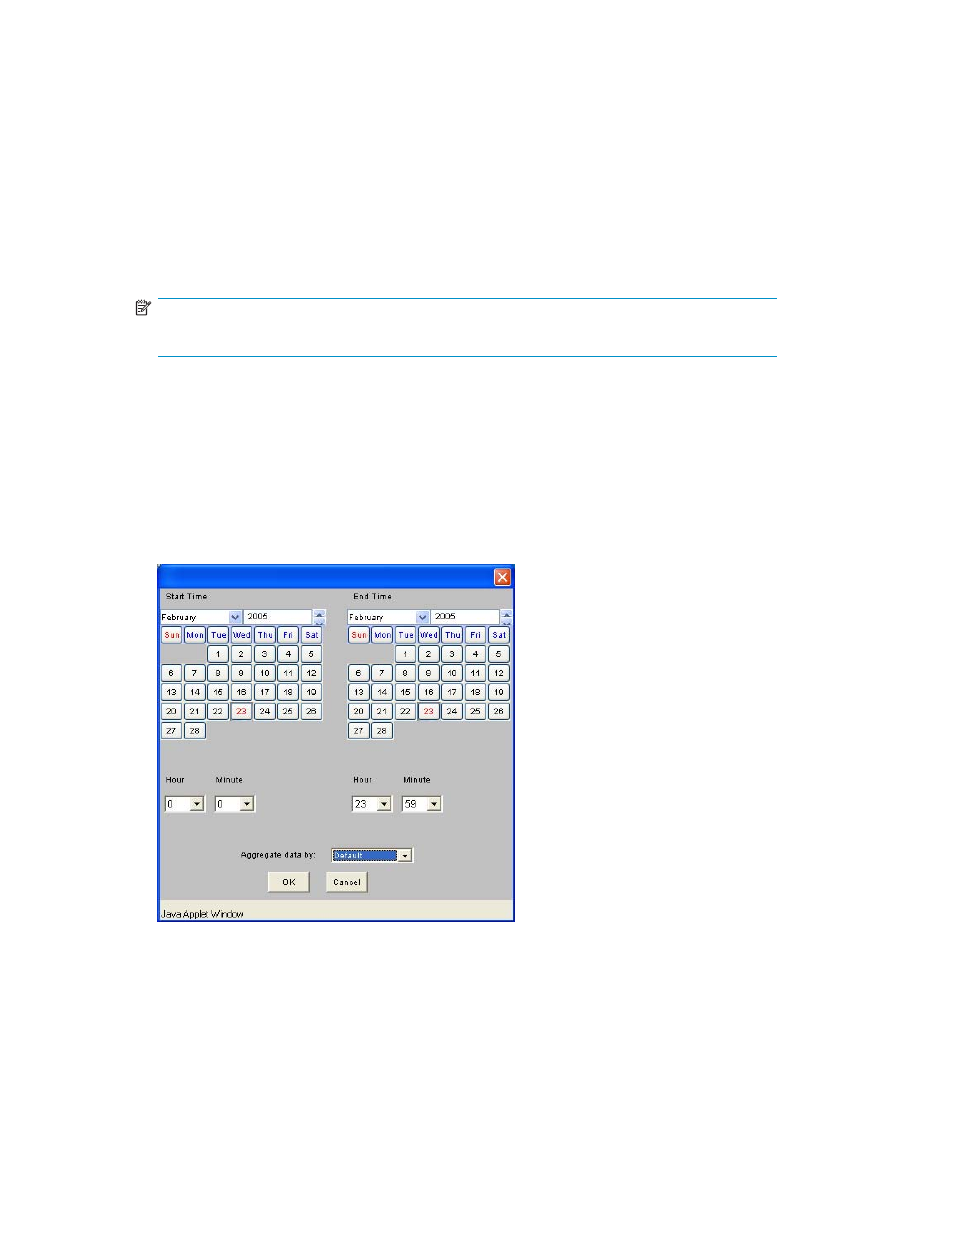
Figure 45 Chart Calendar screen
11.
In the calendar, as shown in
, select the start and end times to filter the data.
For a summary of all items in the Selected Metrics field, use the Aggregate data by drop-down
menu. When you finish making your selections. Click OK to continue, or click Cancel to close the
calendar without making any changes.
12.
Click Set Times to filter the data within a specific start and end time, duration (up to 20 weeks), and
frequency for a specific time zone, as shown in
. Click OK to continue, or
click Cancel to close the window without making any changes.
104
Charts