B appendix, Reports, Array performance reports – HP XP Performance Advisor Software User Manual
Page 131: Total i/o rate report, Total i/o rate, Appendix b
B Appendix
Reports
Performance Advisor supports report generation for the following categories:
• Array performance reports
• LDEV IO reports
• Cache utilization reports
• ACP utilization reports
• CHIP utilization reports
• XP Thin Provisioning (THP) pool occupancy
• Snapshot pool occupancy
• Continuous Access Journal group utilization
The sample reports of are given below.
Array performance reports
The array performance report allows you to view the array performance by measuring the total I/Os,
and the read/write I/Os on each array. There are 6 reports to measure and view array performance,
Total I/O Rate, Total I/O Rate by hour of day, Total I/O Rate Detail, Read-Write Ratio, Read-Write Ratio
by hour of day and Read-Write Detail.
A sample of each reports is given below:
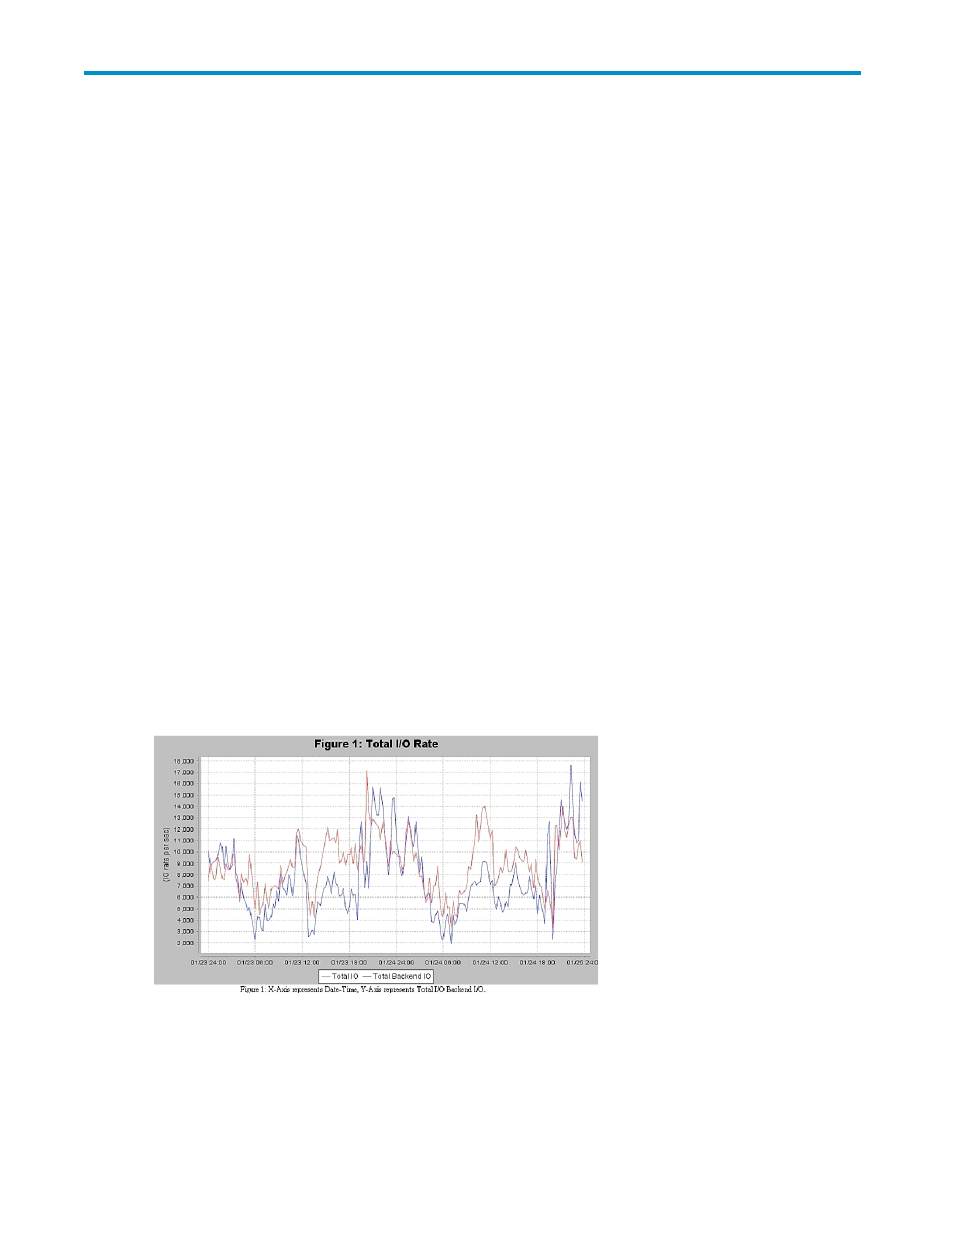
Total I/O Rate report
The Total I/O Rate report shows in a chart format, the number of total read and write I/O operations
per second over the entire data collection period.
shows a sample Total I/O Rate report
for XP1024.
Figure 57 Total I/O Rate
Total Back-end I/O may be compared to Total I/O and the difference is due to the effects of the array
cache. The Back-end I/O load is borne by the Array Groups and ACP pairs, whereas the Total IO load
is borne by the CHIP ports.
HP StorageWorks Performance Advisor XP Software user guide
131