Collecting data – HP XP Performance Advisor Software User Manual
Page 112
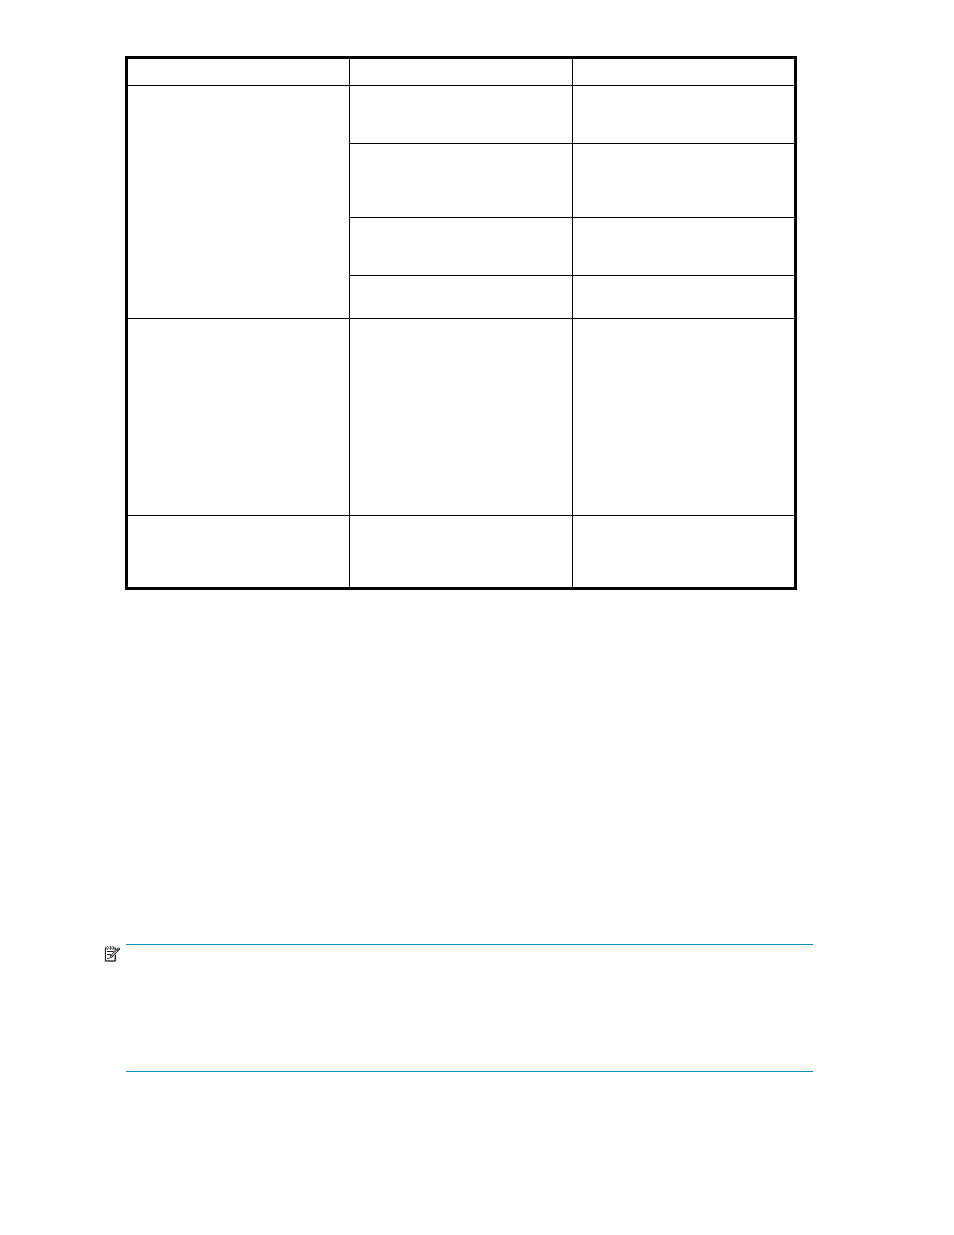
Metric Category
Metric
Description
Cache Usage Util
Cache Writes Pending Util
Cache Sidefile Usage Util
Cache Usage Utilization, Cache
Writes Pending Utilization, Cache
Sidefile Usage Utilization
THP Pool Occupancy
The usage rate of a XP Thin
Provisioning (THP) pool.
The THP Pool Occupancy is
displayed only for XP24000.
SNAPSHOT Pool Occupancy
The usage rate of a Snapshot pool.
The Snapshot Pool Occupancy is
displayed only for XP 24000.
Utilization Metrics, cont.
Journal File Usage Util
The usage rate of a Continuous
Access Journal File.
Backend Metrics
LDEV Sequential Read Tracks
LDEV Non-sequential Read Tracks
LDEV Write Tracks
RAID Group Se-
quential Read Tracks
RAID Group Non-se-
quential Read Tracks
RAID Group Write Tracks
ACP Pair Sequential Read Tracks
ACP Pair Non-se-
quential Read Tracks
ACP Pair Write Tracks
Response Time Metrics
Average Read Response
Maximum Read Response
Average Write Response
Maximum Write Response
Single LDEVs
Collecting data
Use PA XP to display data collected at different collection rates in the same chart as if all of the data were
collected at the same collection rate. (This occurs when collecting from multiple DKCs at different rates.)
To manage varying collection rates, PA XP uses cubic spline interpolation or approximation. The basis
for the interpolation depends on the master that is selected. The master will be the set of data points
that represent the most recent collection period, as well as the shortest collection period. (The shortest
collection period is defined as the collection period where the data is most frequently collected.) After the
system determines the master, the other data points are interpolated to match the master. For example, if
you collected a set of data at five-minute intervals on one DKC, and another set of data at one-minute
intervals on another DKC, the system will carry out its cubic spline interpolation (approximation)
based on the data collected at one-minute intervals. All data will display as if it were being collected
at one-minute intervals.
If the data has the same number of collection points, the master will be the data collected from the DKC
with the shortest collection period. The system will never return more than 1,000 points. (10 points of
data are set as the default.)
NOTE:
If a chart is not produced after you click Show Chart, the time lines of the selected metrics might not
align. In other words, it is possible that old data values (for example, values from one week ago) are not
aligning with new data values (for example, values from yesterday). Other possible causes are that no
data was collected for the time specified, or that data was not collected from the DKC. Check the Java
Console for messages. Click View, and then click Java Console in your browser.
112
Charts