Table 47: fabric events description of fields, Accessing fabric events, 47 fabric events description of fields – HP StorageWorks MSA 2.8 SAN Switch User Manual
Page 191: Elds are described in, Table 47
Fabric Management
191
Web Tools Version 3.1.x/4.1.x User Guide
Accessing Fabric Events
To view events in the fabric, perform the following steps:
1. Access Web Tools.
2. Find the Fabric toolbar.
Perform the following steps to access Fabric Management.
” on
3. Select the Fabric Events icon in the lower corner of the Fabric Tree.
The Fabric Events window will display.
To sort the events by a particular column, select the column header. To resize a
column, drag the column divider.
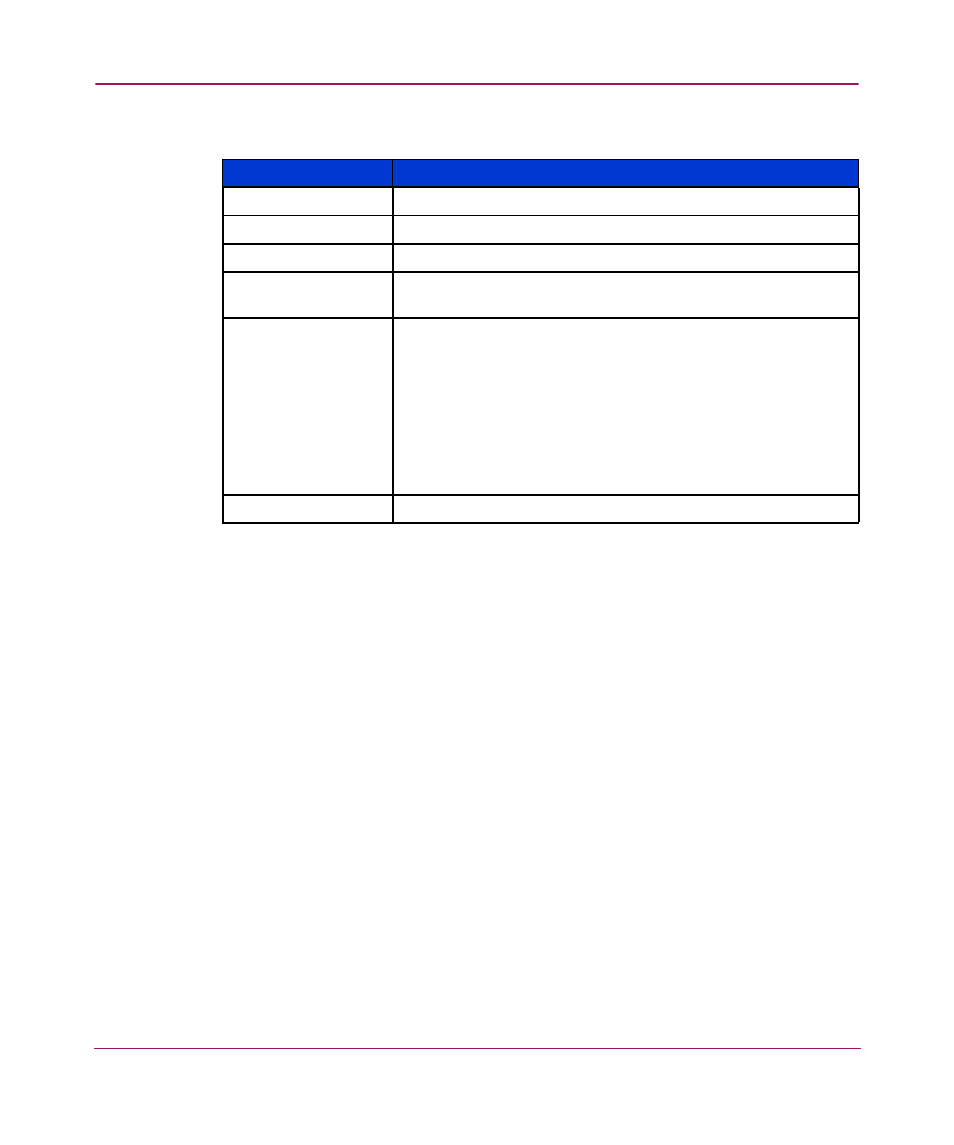
Table 47: Fabric Events Description of Fields
Field
Description
Switch
Displays the name of the switch.
Number
Displays the event number for the affected switch.
Time
Displays the time of the event.
Count
Displays the number of consecutive occurrences of the same
event.
Level
Displays the severity level of event:
0
panic (switch reboots)
1
critical
2
error
3
warning
4
information
5
debug
Message
Displays the description of the event.
- StorageWorks MSL6000 Tape Library (61 pages)
- Лент-е накопители HP StoreEver DAT (64 pages)
- Лент-е накопители HP StoreEver DAT (50 pages)
- StoreEver TapeAssure Software (40 pages)
- StoreEver Ultrium Tape Drives (75 pages)
- StoreEver Ultrium Tape Drives (60 pages)
- Linear Tape File System Software (28 pages)
- Linear Tape File System Software (25 pages)
- StoreEver Ultrium Tape Drives (78 pages)
- StoreEver Ultrium Tape Drives (76 pages)
- Linear Tape File System Software (20 pages)
- StoreEver Ultrium Tape Drives (61 pages)
- 2600fx Optical Disk Drive (65 pages)
- Ленточный автозагрузчик HP StorageWorks DAT 72x10 (58 pages)
- StorageWorks 1500cs Modular Smart Array (52 pages)
- StorageWorks 1500cs Modular Smart Array (71 pages)
- 2000fc Modular Smart Array (150 pages)
- StorageWorks 1000 Modular Smart Array (72 pages)
- StorageWorks 1000 Modular Smart Array (81 pages)
- StorageWorks 1500cs Modular Smart Array (48 pages)
- Servidor de almacenamiento HP ProLiant DL585 G2 (152 pages)
- Sistemas de almacenamiento de red HP StorageWorks X3000 (152 pages)
- Software de HP StoreVirtual VSA (127 pages)
- Software de HP StoreVirtual VSA (85 pages)
- X500 Data Vault (331 pages)
- StorageWorks 1000i Virtual Library System (122 pages)
- StorageWorks XP Remote Web Console Software (20 pages)
- 200 Storage Virtualization System (176 pages)
- XP Array Manager Software (101 pages)
- StorageWorks MSA 2.8 SAN Switch (22 pages)
- StorageWorks MSA 2.8 SAN Switch (104 pages)
- StorageWorks MSA 2.8 SAN Switch (270 pages)
- StorageWorks All-in-One SB600c Storage Blade (72 pages)
- StorageWorks All-in-One SB600c Storage Blade (80 pages)
- StorageWorks All-in-One SB600c Storage Blade (78 pages)
- StorageWorks All-in-One SB600c Storage Blade (60 pages)
- ProLiant DL585 G2 Storage-Server (150 pages)
- Data Protector Express Basic-Software (83 pages)
- Data Protector Express Basic-Software (93 pages)
- ProLiant DL185 G5 Storage Server (174 pages)
- ProLiant High Availability Storage Server (72 pages)
- 2000I G2-Modular-Smart-Array (48 pages)
- P2000 G3 MSA Array Systems (58 pages)
- StorageWorks 2000fc G2 Modular Smart Array (76 pages)