Displaying waveforms of different intervals, Displaying waveforms of different intervals -11, Index – Yokogawa DAQWORX User Manual
Page 47: Dsplayng waveforms of dfferent intervals
3-11
IM WX201-01E
Operat
on of the T
rend D
splay W
ndow
1
2
3
4
Index
Tme Axs Dsplay Area
• The time display shows the time of the channel. When the time reference mode
is Start Reference, Trigger Reference, or End Reference, the time of the active
channel is displayed.
• The time display shows the time relative to the start of the waveform display area.
Showng Channel Detals
In the Trend display screen, the information of the active channel is displayed.
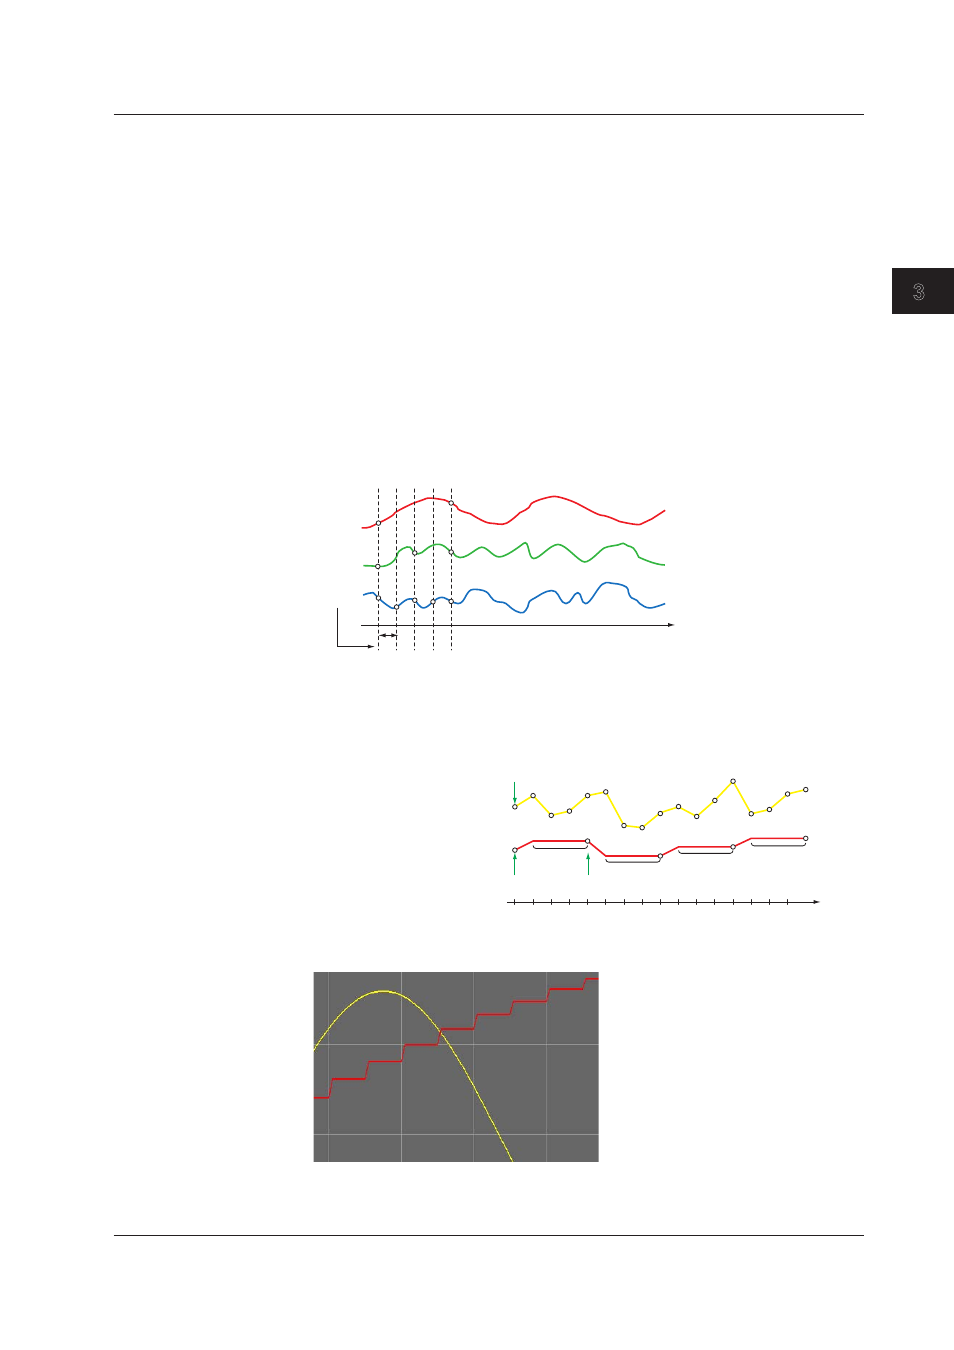
Dsplayng Waveforms of Dfferent Intervals
Data of differing measurement intervals can be displayed in the same waveform display
screen.
Measurement Interval of Dsplayed Waveforms
When the measurement intervals differ, the greatest common factor of the
measurement intervals of the channels assigned to the displayed groups is used as
the minimum interval unit for displaying all of the waveforms. In the figure below,
since the intervals for the three channels are 1 s, 500 ms, and 250 ms respectively,
250 ms is used as the interval when all channels are displayed together.
1s
500ms
250ms
250ms
Greatest
common
factor
Dsplayng Waveforms of Intervals Greater Than the Mnmum Unt
If a channel’s interval is longer than the minimum unit interval, data values that are not
measured points are displayed at the value of the points directly thereafter.
Measured point
Measured point
Same value
Same value
Same value Same value
Longer than the minimum unit
interval waveform
Minimum unit interval waveform
Minimum unit display interval
Measured point
The figure below shows a 100 ms and 1 s interval waveform. The waveform with the
long interval is displayed in stages.
Mnmum Unt Interval for Lnked Groups
The greatest common factor of the measurement interval of all channels registered to
all groups belonging to the linked group is used as the minimum unit interval.
3.4 Dsplayng Trends