E-Mon E-PS-E-RTU-N User Manual
Page 116

Chapter 7 Monitoring Meters Viewing Real-time Data
116
PowerSmart+ Power Quality Meter
PowerSmart+ PQM . To re-organize data sets, select RT Data Sets from
the Monitor menu or click on the button
on the local toolbar.
Some data sets are preset for your convenience and others are empty.
You can freely modify data sets.
See Appendix D for a list of data available in your meter.
Polling Options
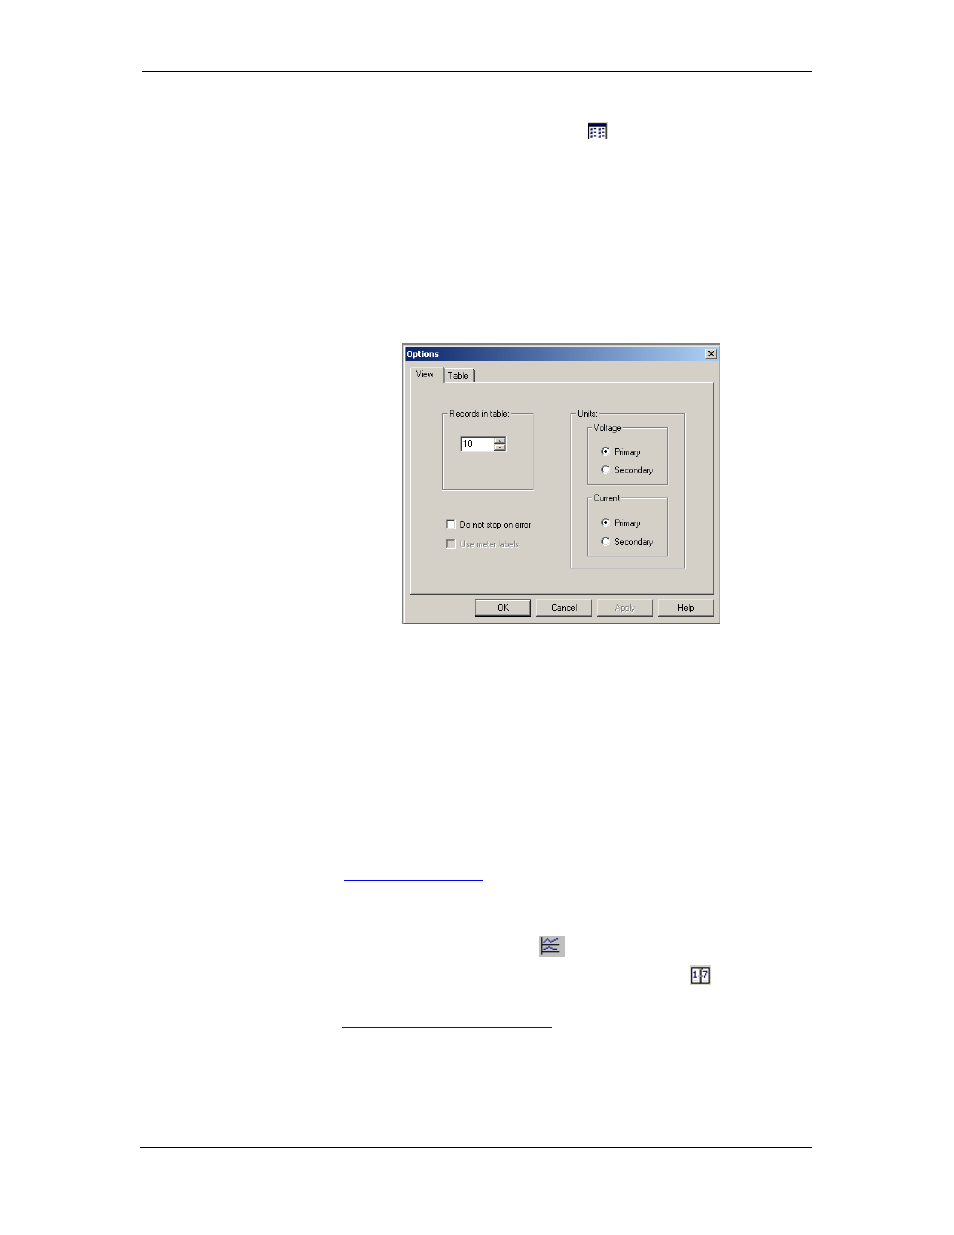
To change the polling options, click on the Data Monitor window with the
right mouse button and select Options.
If you check Do not stop on errors, polling is resumed automatically
when a communication error occurs, otherwise polling stops until you
restart it manually.
Viewing a Data Table
Changing the Data View
Power Software displays data in either a single record or multi-record
view. To change the view, click on the Data Monitor window with the
right mouse button and select either Wrap to see a single record, or
UnWrap to go to the multi-record view.
Adjusting the Number of Rows in a Multi-Record View
Click the window with the right mouse button, select Options, adjust the
number of records you want to see in the window, and then click OK.
When the number of retrieved records exceeds the number of rows in the
window, the window scrolls up so that older records are erased.
See
Working with Tables
in Chapter 9 for more information on working
with tables.
Viewing Data Trend
To view a data trend, click on the
button on the local toolbar.
To change the time range for your graph, click on the
button on the
local toolbar, and then select the desired date and time range.
See
Working with Graphic Windows
in Chapter 9 for more information on
working with graphs.
