Figure 35, Rmon ethernet: chart in a bar graph format – Nortel Networks 380-24F User Manual
Page 94
94
Chapter 5 Configuring remote network monitoring (RMON)
214394-A
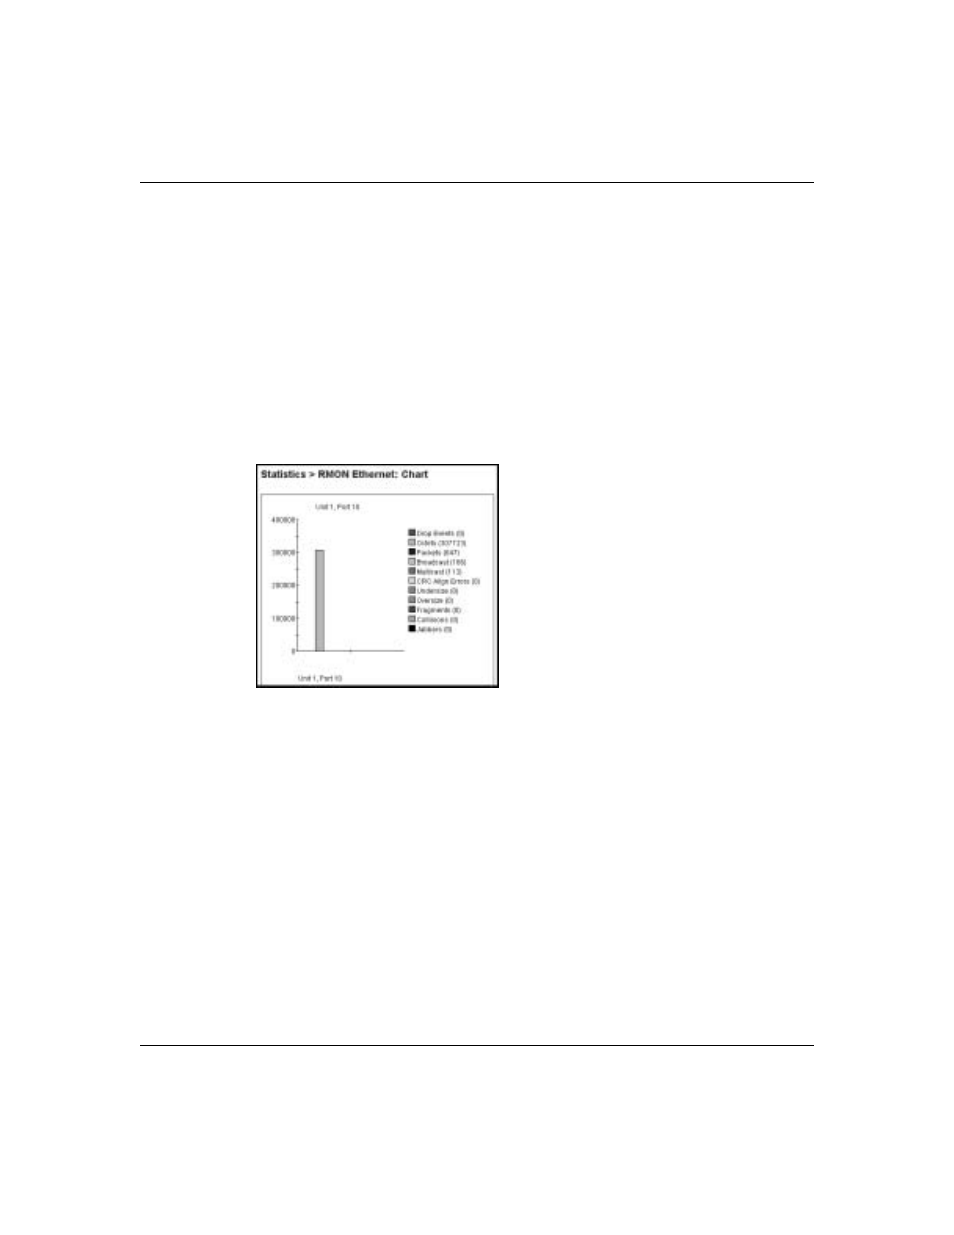
Viewing RMON Ethernet statistics in a bar graph format
To view RMON Ethernet statistics in a bar graph format:
1
From the main menu, choose Statistics > RMON Ethernet.
The RMON Ethernet page opens (
).
2
In the port row of your choice, click the bar graph icon.
The RMON Ethernet: Chart page is displayed in a bar graph format
Figure 35 RMON Ethernet: Chart in a bar graph format
3
To refresh statistical information, click Update, or click Back to return to the
Ethernet Statistics page.