Figure 50, Transparent bridging: chart in a bar graph format – Nortel Networks 380-24F User Manual
Page 115
Chapter 6 Viewing system statistics
115
Using Web-based Management for the BayStack 380-24F Gigabit Switch
The Transparent Bridging page opens (
).
2
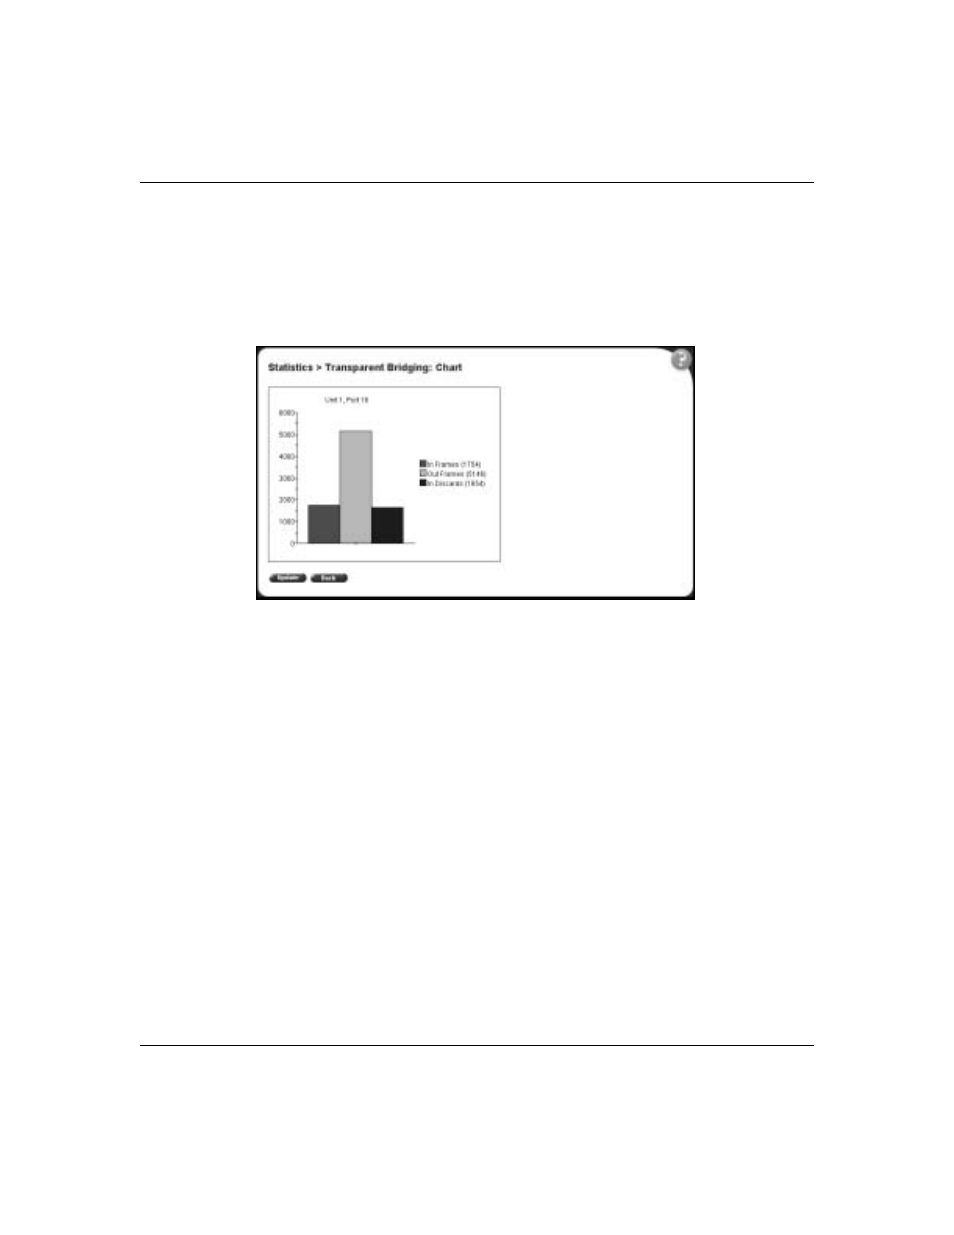
In the port row of your choice, click the bar graph icon.
The Transparent Bridging: Chart page opens in a bar graph format
Figure 50 Transparent Bridging: Chart in a bar graph format
3
To update the statistical information, click Update, or click Back to return to
the Transparent Bridging page.