Example 1. wan – PLANET CS-2000 User Manual
Page 551

CS-2000 UTM Content Security Gateway User’s Manual
- 545 -
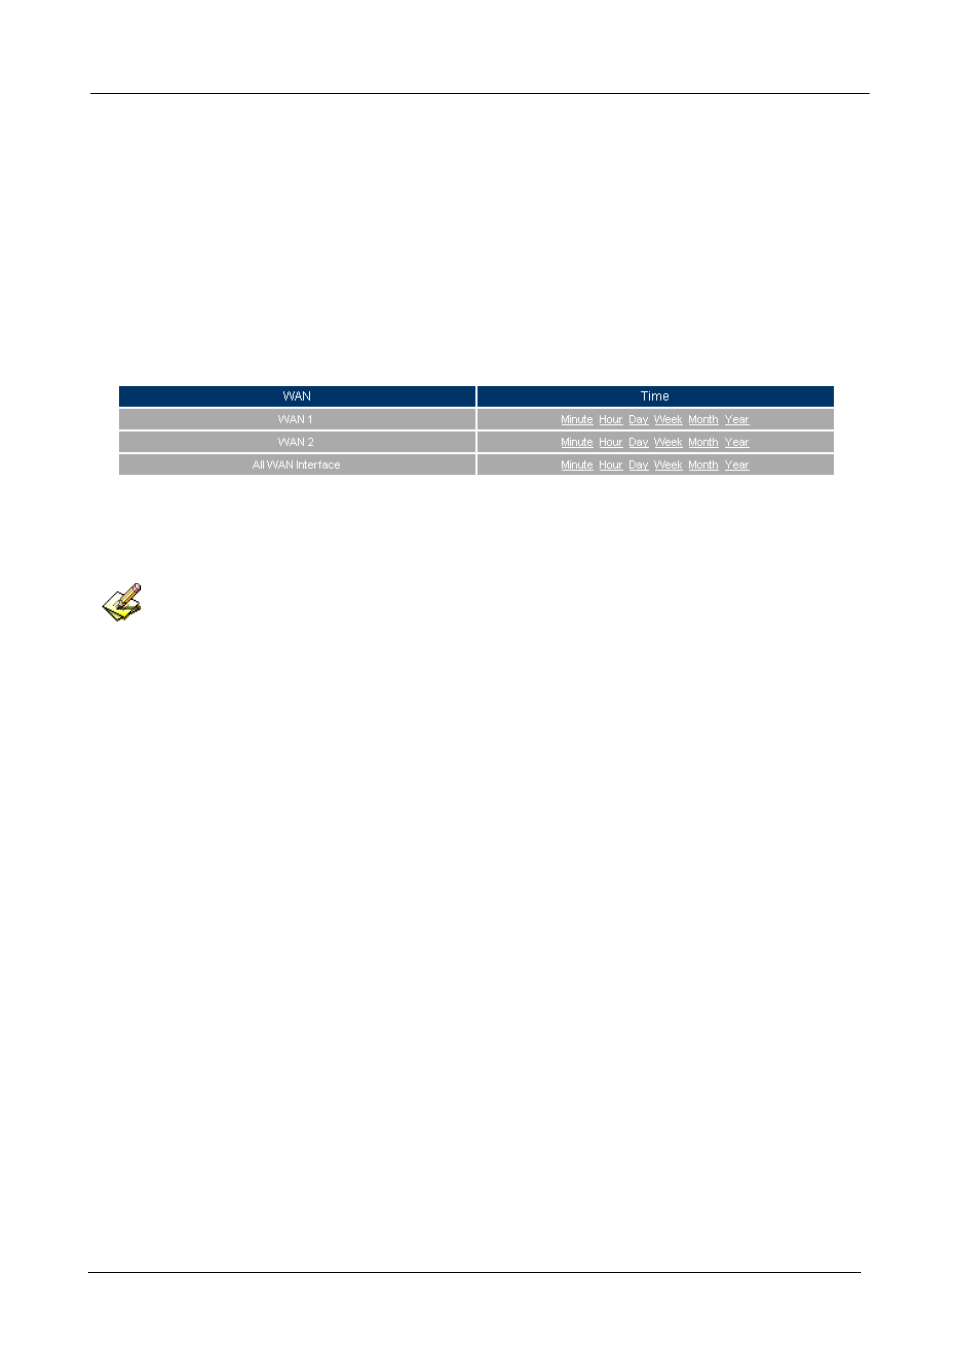
Example 1. WAN
Step1 Statistics
Æ
WAN, it shows all the downstream / upstream packets and statistics pass through
WAN interface.
Time:View the statistics charts according to the unit of minute, hour, day, week, month, and
year.
The WAN statistics
The WAN statistics is the attached function of WAN interface. The WAN statistics enabled as
enabled the WAN interface.
Step2 Statistics
Æ
WAN, select the WAN to view.
Click
Minute, to view the statistic charts results in every minute.
Click
Hour, to view the statistic charts results in every hour.
Click
Day, to view the statistic charts results in every day.
Click
Week, to view the statistics charts results in every week.
Click
Month, to view the statistics results in every month.
Click
Year, to view the statistics charts results in every year.
Step3
Statistic charts
Ordinate:Network flow.
Horizontal
ordinate:Time (hour / minute).
