Setting the timer statistics interval, Repeater performance graphs, Setting the timer statistics interval -8 – Enterasys Networks 2000 User Manual
Page 136: Repeater performance graphs -8

Managing Ethernet MicroLAN Switches
5-8
Repeater Statistics
% Errors
The percentage of errors processed by the selected repeater, board, or port during
the user-defined time interval.
Setting the Timer Statistics Interval
To set the Timer Statistics time interval:
1.
Click on the clock symbol (
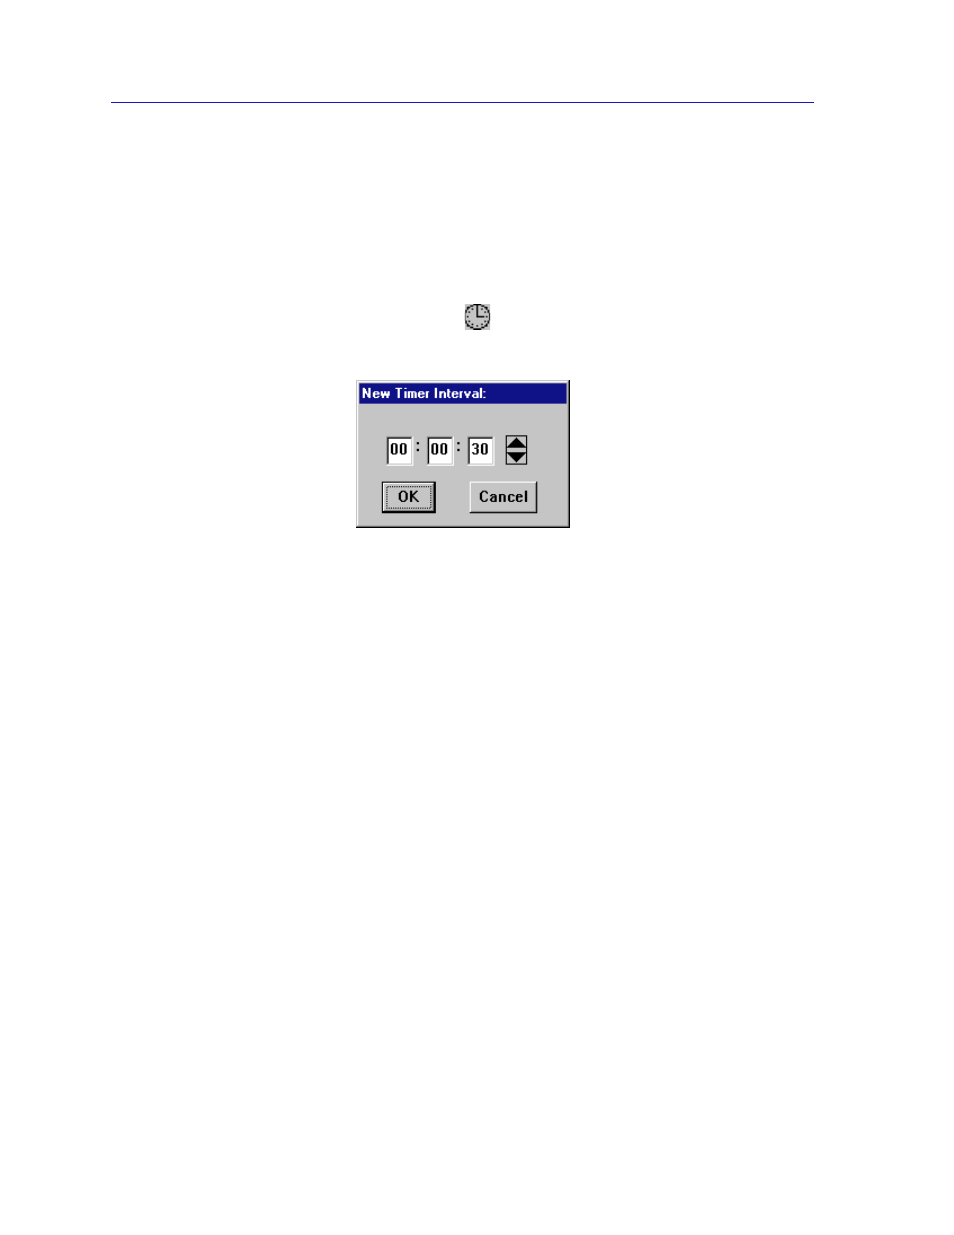
) next to the Interval text box. The New Timer
Interval text box,
, opens.
Figure 5-3. New Timer Interval Text Box
2.
Highlight the hour field in the New Timer Interval text box and enter a new
hour or use the arrow keys to the right of the text box to scroll to change the
hour, as desired. The time is given in a 24-hour hh:mm:ss format.
3.
Repeat step 2 to change the minutes and seconds fields, as desired.
4.
Click OK when you are finished entering new information. The new Time
Interval you have set is now entered.
The Timer Statistics window will refresh to zero, and the new time interval will
take effect immediately.
Repeater Performance Graphs
With the Repeater Performance Graphs, you can use real-time statistics reporting
to see at a glance the amount of traffic going through your Ethernet MicroLAN
Module at the repeater, board, or port level. These windows provide current
statistics both graphically and numerically. The graph has an X axis that indicates
the 60 second interval over which charting occurs continuously, while the Y axis
measures the number of packets or errors that are processed by the selected
repeater, board, or port. The Detail buttons brings up an additional window that
displays a breakdown of the traffic by error type.
You can select the graphing and statistics parameters by using the command
buttons (for Percent Load, Frames, or Errors) and their associated menus. When
you alter a parameter, the new parameter displays on the face of the button, and
the statistics will refresh to zero activity before regenerating.
