5 - setting limits, Setting limits 5 – Measurement Computing eZ-NDT version 6.0.9 User Manual
Page 47
eZ-NDT
938895
Setting Limits 5-1
Setting Limits
5
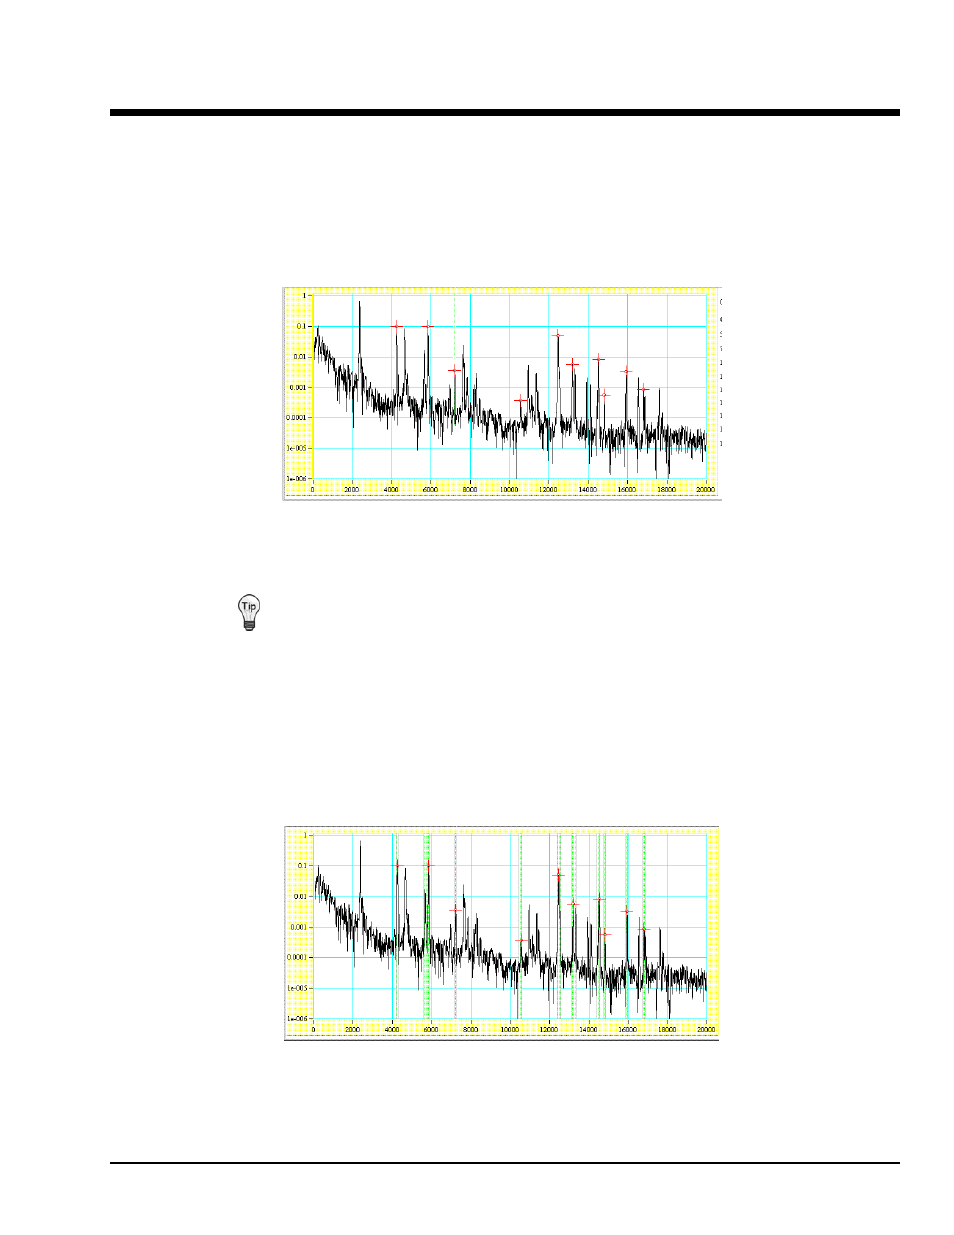
Limits are defined frequency and amplitude ranges (where the resonances of a part will peak) across the
x-axis. In our example, we impacted several known good parts and captured a sample resonance in the
following display. We then placed cursors at the peaks we thought were significant. These same peaks
may change in amplitude or shift frequency if a part is bad. Please note that significant peaks are not
always the ones with the most amplitude. In fact, some of the peaks at lower amplitudes can be very
significant because when they are below a certain amplitude it indicates that the part is “bad.”
Significant Peaks
Now that we know where the peaks are located, we can set the limit range in which they will appear.
Use the cursor values listed to the right of the plot to help you determine where frequency and
limit ranges should be set.
Note that the first cursor is at 4250 and that there is another peak at approximately 4800, which we did not
mark with a cursor. However, if a part is bad, that peak may shift down in frequency. Therefore, when
setting our “good” limit, we must make sure that we set it low enough so that the resonance shift of the
“bad” peak doesn’t create a peak within our “good” limits.
In our example we set the frequency range from 4050 to 4450 and the frequency limits between 4150 and
4350. Remember our “good” peak should be around 4250.
Setting Limits using Significant Peaks