Modifying limits from the main window, Magnifying areas on graph – Measurement Computing eZ-NDT version 6.0.9 User Manual
Page 27
eZ-NDT
878493
Windows and Menus 4-
7
Modifying Limits from the Main Window
Add Limit Band: Using your mouse, right click on a Limit Range cell. Check “enabled,” then click the
Remove Limit Band: Using your mouse, right click on a Limit Range cell. Un-check “enabled,” then
click the
Moving the Limit Band: To move a limit band, first unlock the Graphic Limits with the padlock icon
button; then select the desired Limit Range cell. Using your mouse, right-click anywhere within the band.
At this point you’ll see a crosshair. While pressing the right mouse-button, move the crosshair to the new
x-axis position. The Limit Band will relocate.
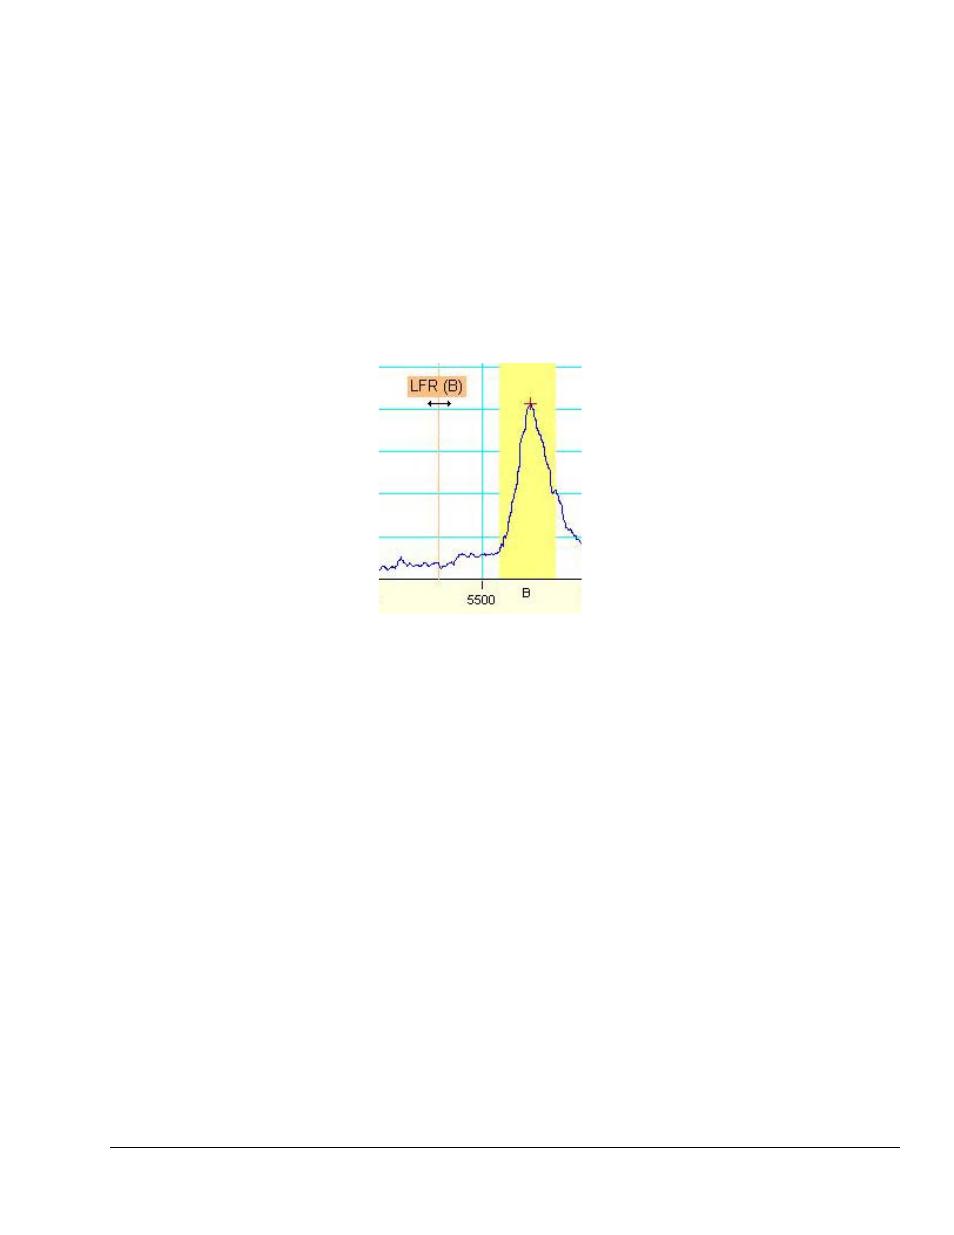
Changing the High and Low Frequency Range Limits: First unlock the Graphic Limits with the
padlock icon button; then select the desired Limit Range cell. Next place the mouse cursor of the vertical
line of the High or Low range limit. “HFR” or “LFR” will appear in a box (see preceding figure). Use the
double-arrow to adjust the limit. Note that you can also use the properties box to adjust the range limits, as
discussed on the previous page.
Adjusting the Low Frequency Range Limit
Other limit modifications include increasing or decreasing
•
Limit Band Frequency
•
Limit Band Amplitude
Adjustment of the Limit Band Frequency and Amplitude is discussed and illustrated in chapter 2, in the
section titled, 13. Verify the Limits and Ranges.
Magnifying Areas on Graph
X-axis: Hold down the
Y-axis: Hold down the
Both axes: At the same time, hold down the
the area of interest.
In each of the above cases the x and y axis scales will automatically change to reflect the new view. Click
the