Display toolbar – Measurement Computing eZ-NDT version 6.0.9 User Manual
Page 25
eZ-NDT
878493
Windows and Menus 4-
5
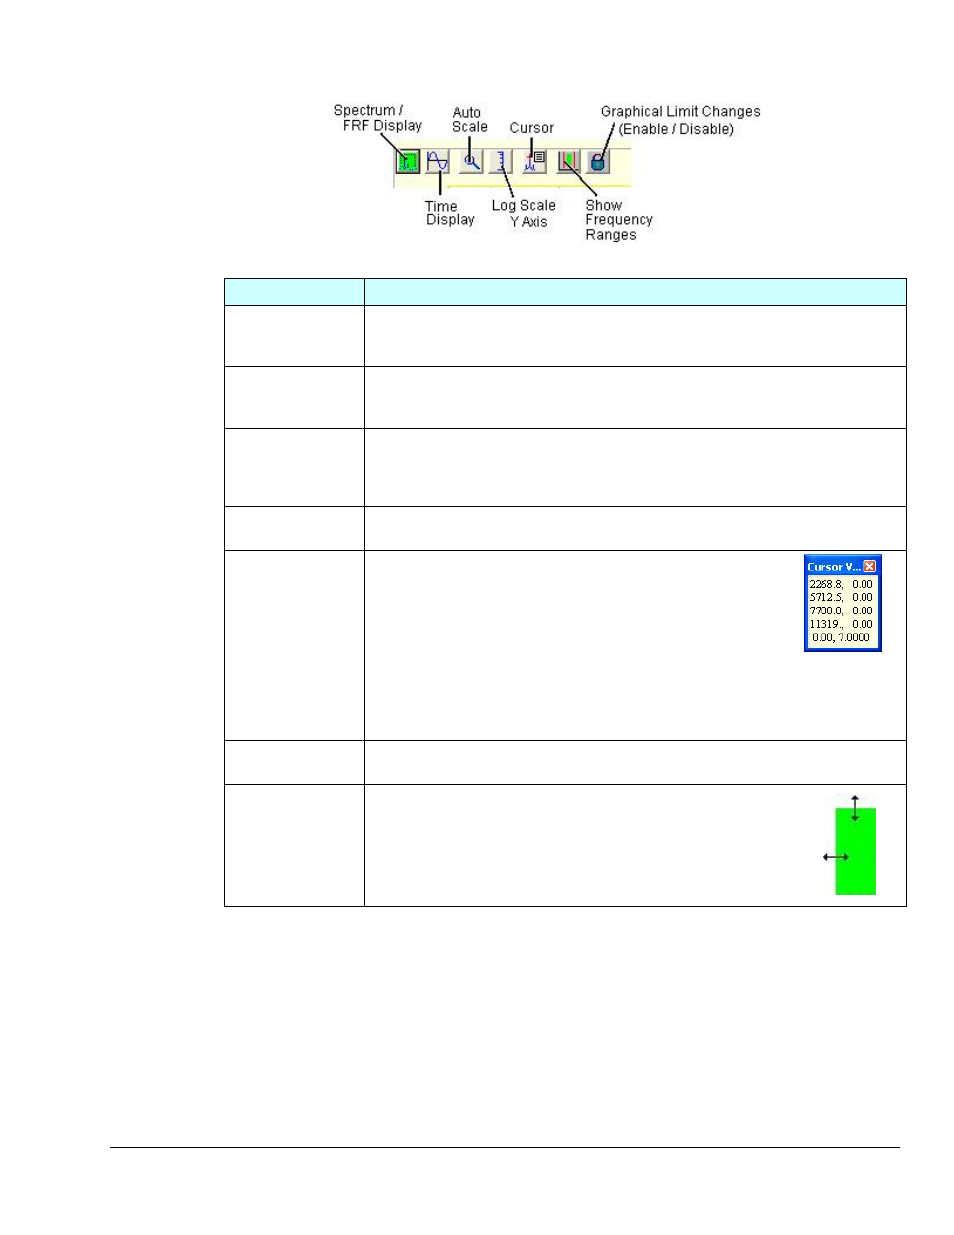
Display Toolbar
Display Toolbar
Button
Function
Spectrum/
FRF Display
Sets the window to display data with the x-axis scaled to frequency and
the y-axis scaled to dB or engineering units, depending on the setting in
the Acquisition tab of the Configuration window.
Time Display
Sets the window to display data with the x-axis scaled to time and the
y- axis scaled to dB or engineering units, depending on the setting in the
Acquisition tab of the Configuration window.
Auto Scale
Automatically adjusts the scale. Auto scale will be either enabled or
disabled. When enabled, the Y axis scale is 20% greater than the data
range. When disabled, the Y-axis scale is defined by the instrument
range in the configuration.
Log Scale Y Axis
Only applies to Spectrum/FRF Display. This sets the y-axis to a
logarithmic scale. Note that Time displays are always linear.
Cursor
Click the Show Cursor Values Icon to open a floating
display of the cursor values. Click on the upper left
corner of the display to move it anywhere on the screen.
Values are displayed in the x, y format.
Cursor values exist for each defined limit range. The
cursor is automatically positioned to the highest peak in
the limit range. You can move the cursor by dragging it
across the graph with your mouse or by using the
keyboard. The “, (comma)” key moves the cursor Left.
The “. (period)” keys move the cursor Right
Show Frequency
Ranges
Uses vertical lines to identify High and Low Frequency Limit Ranges for
the Spectrum / FRF display.
Graphical Limit
Changes
(Enable /
Disable)
When the padlock image is unlocked, limit bands can be
adjusted with a mouse as described in chapter 2’s step
13.
When the padlock image is locked, limit bands cannot be
altered. This feature prevents limits from being
accidentally changed.