Graphical display, Limit range – Measurement Computing eZ-NDT version 6.0.9 User Manual
Page 26
4-
6
Windows and Menus
878493
eZ-NDT
Graphical Display
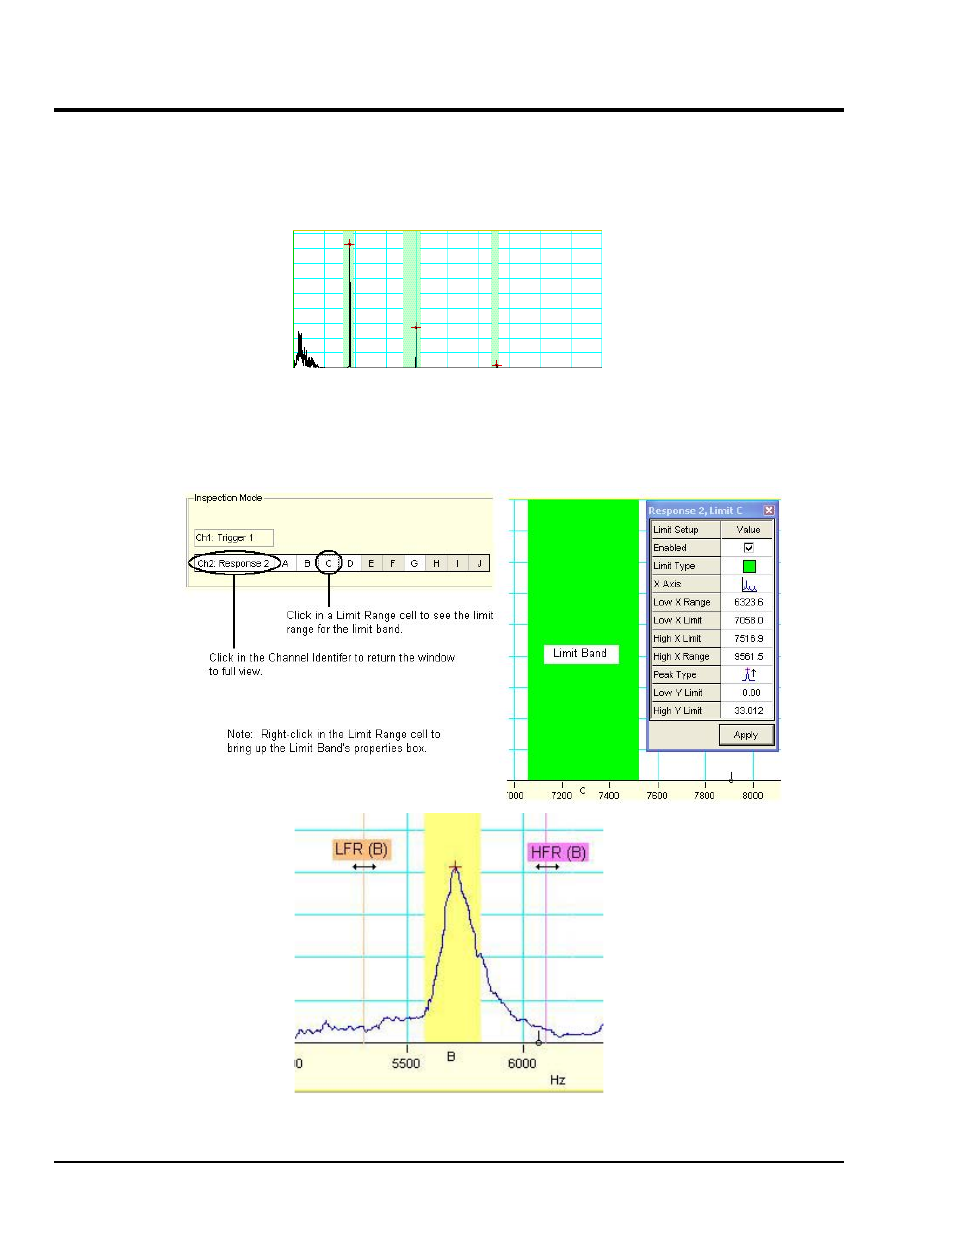
Limit Range
The Graph displays the results of a strike. The acceptance limit regions are shaded in green;
failure limit regions are shaded red.
Graph Displaying Three Acceptance Limit Regions
The Limit Range cells are used to access a specific Limit Band (lettered A through J). Right-clicking on a
Limit Range cell brings up a properties box, which allows you to change Limit Band parameters and Low
and High Frequency Range limits. Left-clicking on a cell focuses in on the limit aspect for the associated
band. Note that you can also select a Limit Band from the View pull-down menu.
Adjusting Low and High Frequency Range Limits for Cell B
This manual is related to the following products: