Select investigation mode, Configure the analyzer, Select “spectrum/frf display” as the plot type – Measurement Computing eZ-NDT version 6.0.9 User Manual
Page 10: Turn on data acquisition
2-4 Investigation Mode Testing
938691
eZ-NDT
If you created a new folder...
With “New Folder” highlighted, type a name for the Project Folder. Then, double-click on the folder to
open it. This is where you will save your new project files.
c. Type a filename for the project, including the file extension, in the File name data entry box.
i.e. part234.ndt
DO NOT use NDT.ndt as a filename. NDT.ndt is the default template. A good file
name is on that identifies the part, for example, part232.ndt.
d. Click the Save button to create the new project. Now all the files for this project will be saved in the
folder you just used.
5.
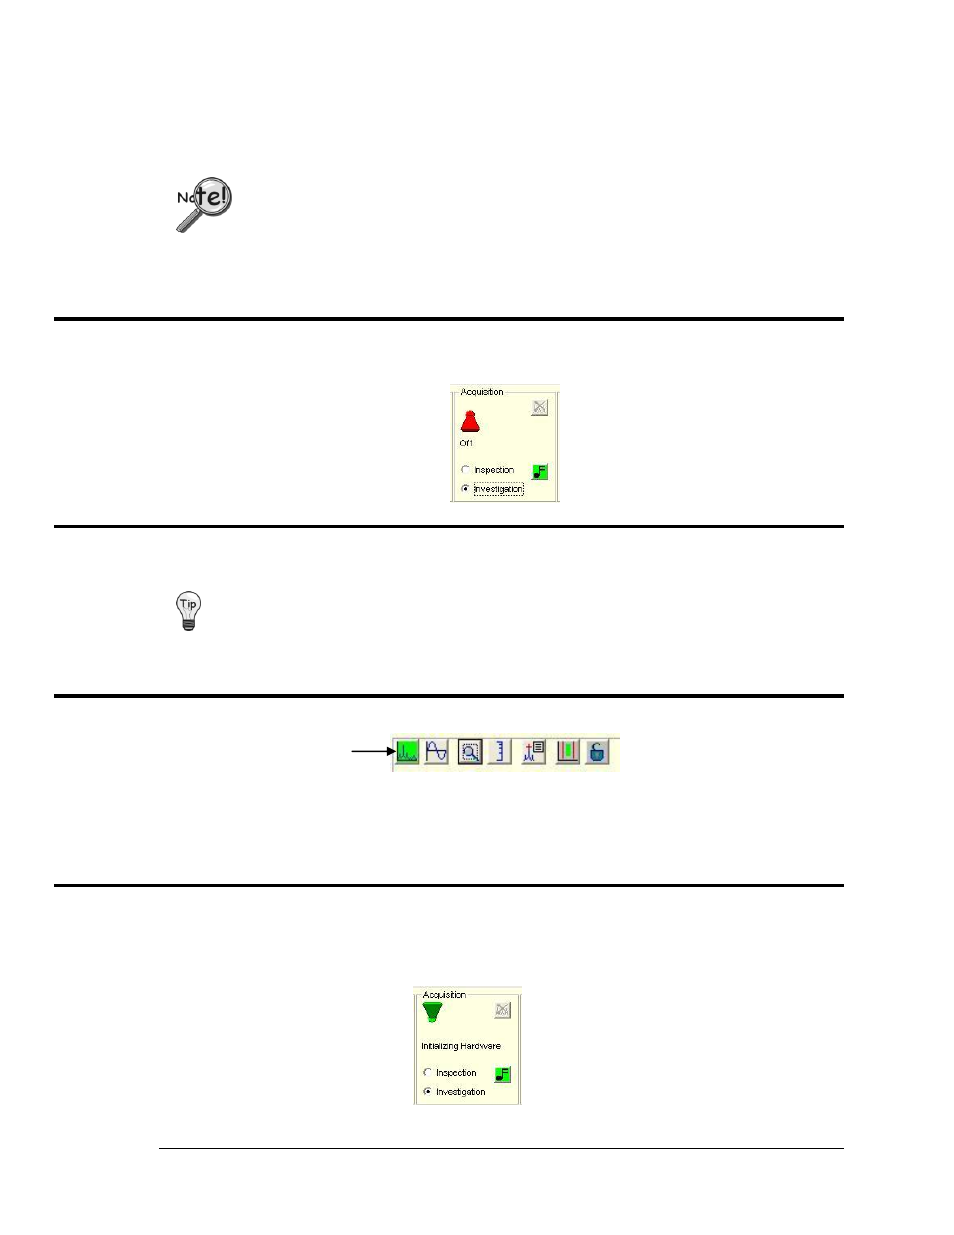
Select Investigation Mode.
On the main screen select Investigation Mode.
6.
Configure the Analyzer.
To start use the default values.
If you have tested both good and bad parts, and you do not see a difference between them,
you may need to modify one or more of the configuration values. Increasing the Trigger
Delay is the most common solution.
7.
Select
“Spectrum/FRF Display” as the Plot Type.
The plot display types are selected by clicking on one of the first two buttons. The first button on the left is
“Spectrum / FRF Display.” The second button is “Time Display.”
For our “Investigation Mode” we want to use the “Spectrum/FRF Display” for the type of plot. Click on
the Spectrum icon (first button).
8.
Turn on Data Acquisition.
To initialize the hardware and turn on the data acquisition, click the red toggle switch in the Acquisition
panel of the Main window. The toggle switch will flip up and change from red to green. Prior to
proceeding, wait for the status to change form “Initializing Hardware” to “Ready.”
Spectrum/FRF Display