Compare the results of good and bad, Tests ……2-7, Configure the limits …… 2-7 – Measurement Computing eZ-NDT version 6.0.9 User Manual
Page 13: Compare the test results of pass and fail parts, Configure the limits
eZ-NDT
938691
Investigation Mode Testing 2-7
11.
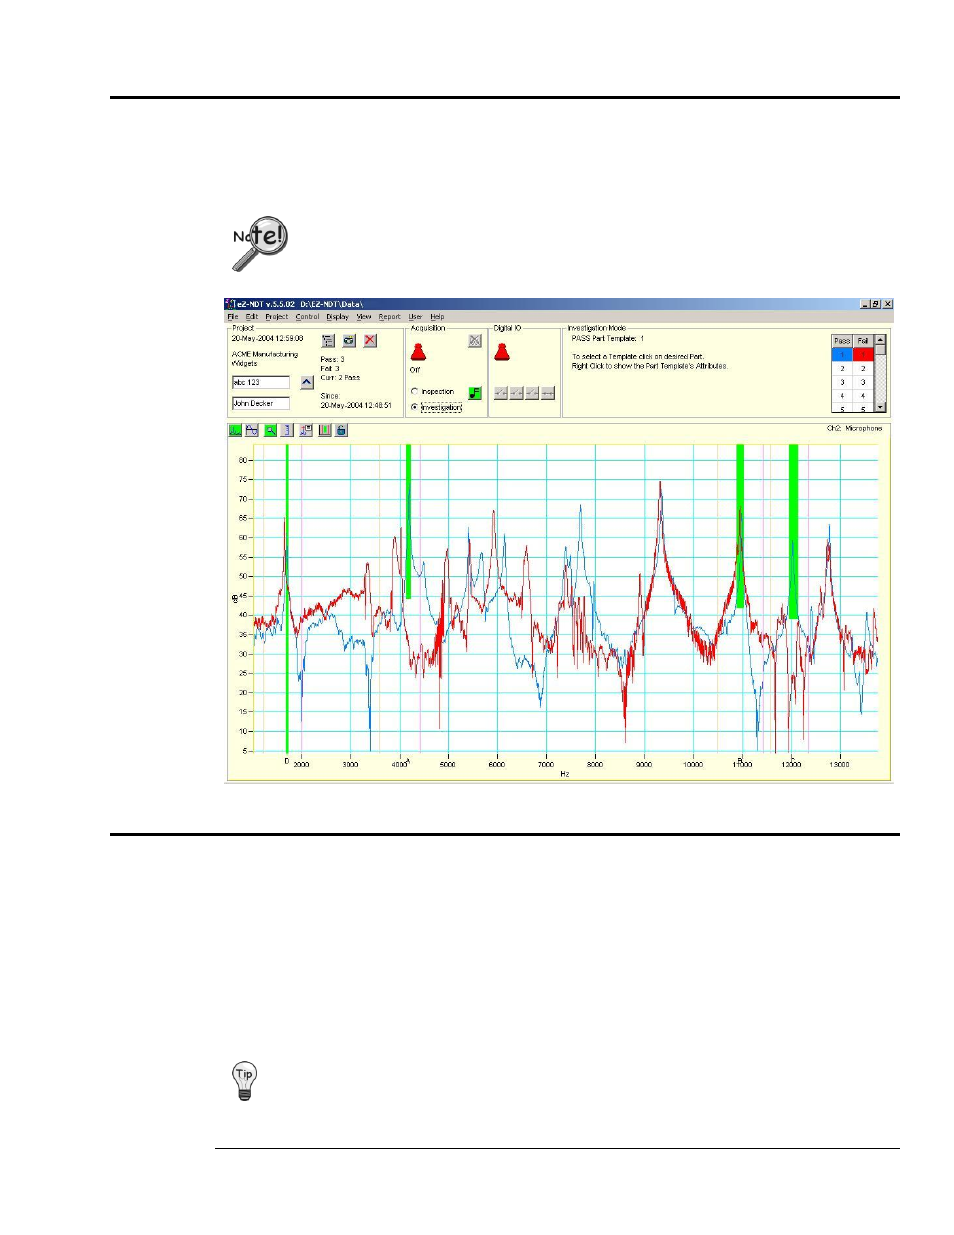
Compare the Test Results of Pass and Fail Parts.
Visually locate the spectral differences between the Pass and Fail parts. You should be looking for
resonant peak(s) that shift in frequency (e.g., red lines to the left or right of the blue line) and/or amplitude
(red lines shorter or taller than the blue line). If blue and red peaks are almost identical, they are probably
not good choices. Ideally you will find significant single peaks.
Because this process detects internal, non visible defects, you may have an occasional
part fail, which you thought was a “Pass” part.
Using Investigation Mode, Comparing a Good Part to a Bad Part
12. Configure the Limits.
Modify the limit bands to match the “Pass” part’s spectral peaks that you want to use. As mentioned earlier,
this is an iterative process. Quite often, some of your “Pass” parts will fail with these exact limits the first
time.
eZ-NDT will find the maximum spectral amplitude in a frequency range. If this point is in the defined limit
region, the range status is “Pass.”
The default step includes four limit bands, already placed on the plot. These limit bands are green
acceptance limits [peaks for subsequently tested parts must be within these limits to be counted as “Pass”
parts]. Working from left to right, drag the first band to the first peak you want to use. Next, drag the
second band to the second peak you want to use, etc.
If you do not need all four of the limit bands, remove the extra ones. Instructions for removing and
adding limit bands follow.